6 min read
 Key takeaways
- Japan’s Nikkei 225 has bounced for a second session as the global recovery in chip and AI stocks sweeps through Tokyo, led by semiconductor names.
- On the daily chart, price has fallen below the ascending trendline and the daily 20 and 50 EMA, but support has held inside the reload zone as the index approached the 64,000 area.
- A reclaim of the 0.618 level is the first thing we are watching, as it would break the top of the local downtrend channel and could open a path back towards the all-time high region.
- On the 4H, the 0.618 has just rejected price, leaving the 65,000 to 66,000 zone as support while we wait to see whether buyers and volume can confirm the move.
Japan’s Nikkei 225 surged again on Wednesday, extending a sharp two-day rebound as the global recovery in chip and artificial intelligence (AI) stocks swept through Tokyo. Semiconductor names led the advance, with the index opening close to 700 points higher and briefly running more than 1,000 points into the session, building on a rally of roughly 2,100 points the day before.
The bounce follows a punishing week for the sector, when the US Philadelphia Semiconductor Index briefly fell into bear-market territory on fears that cheaper Chinese AI models could undercut the industry. Dip-buyers have since treated that sell-off as a reset rather than a turning point, encouraged by strong South Korean export data pointing to still-firm AI demand. A weaker yen, hovering near a four-decade low against the dollar, has added a further tailwind for Japan’s exporters, though it keeps the risk of official intervention in view.
The rebound still has plenty in its way. Oil has pushed higher again on the ongoing Middle East conflict, US long-term yields have climbed, and investors are treading carefully ahead of a heavy night of US earnings, with Tesla, Alphabet and IBM all reporting after the close and the Federal Reserve meeting to follow next week.
Nikkei daily chart
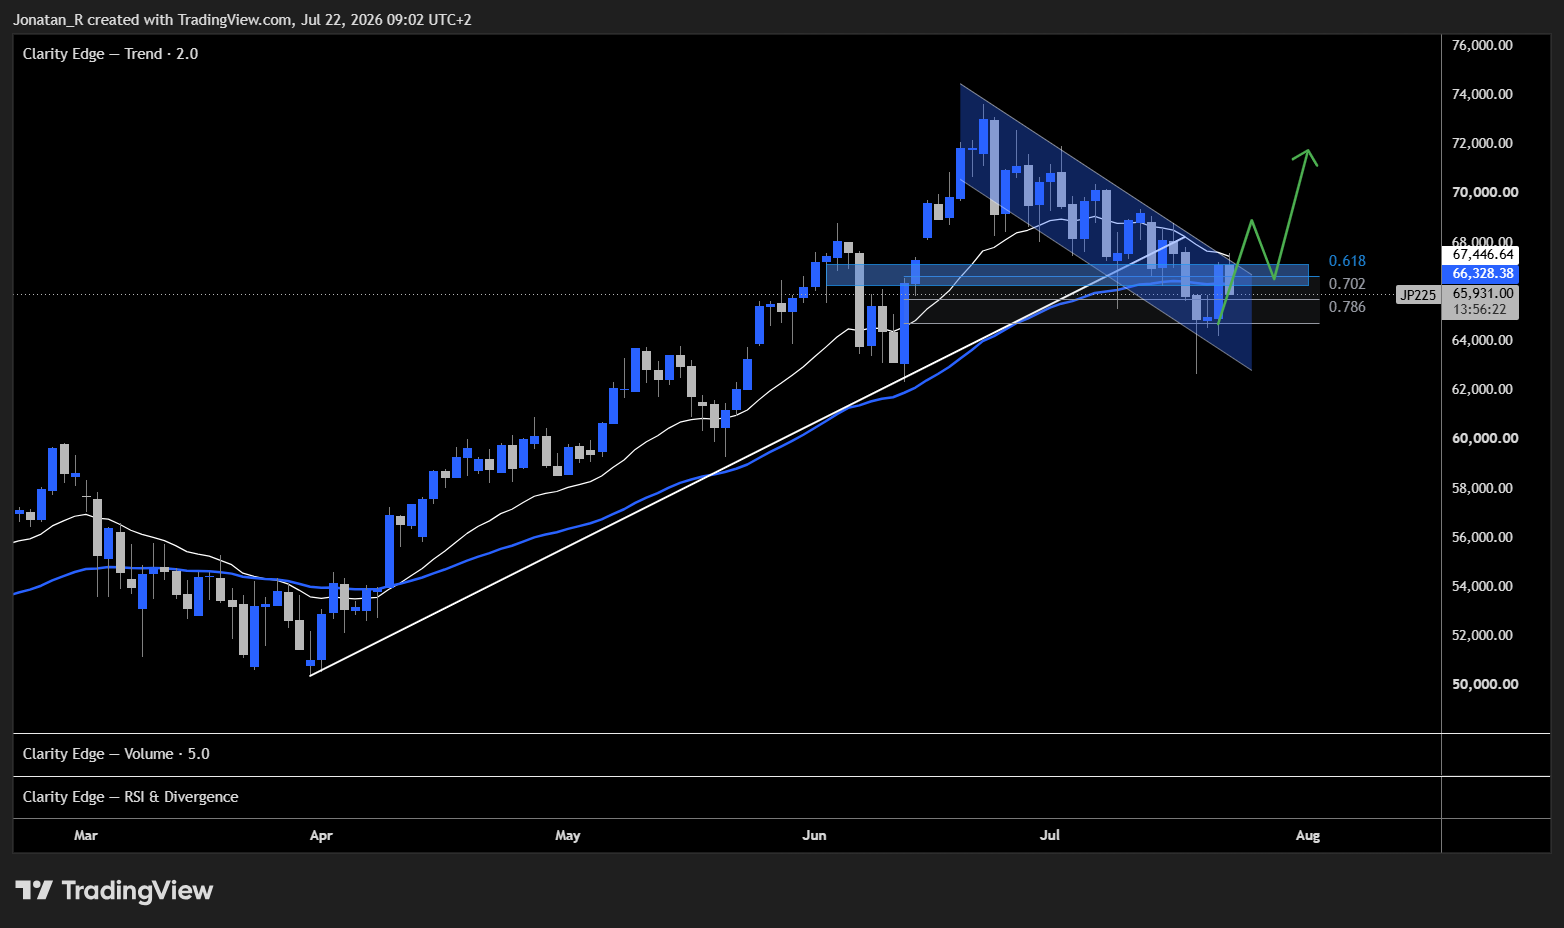
Nikkei 225 daily chart showing price holding support inside the reload zone below the broken ascending trendline and the daily 20 and 50 EMA.
Since our previous coverage of the Nikkei, price has fallen below the white ascending trendline and is now trading below both the daily 20 and 50 EMA. As the index approached the 64,000 level, though, we saw support holding within the reload zone, the area between the 0.618 and the 0.786 retracement. From there we have had a daily indecision candle at the low around 21 July, followed by yesterday’s bullish candle. Price is still trading inside the local downwards-trending channel. A reclaim of the 0.618 level would also mean a break above the upper limit of that channel, and potentially a reclaim of the daily 20 and 50 EMA. That would be a first potential sign of recovery for the Nikkei, and it could take the index back up towards the all-time high region.
Nikkei 4-hour chart
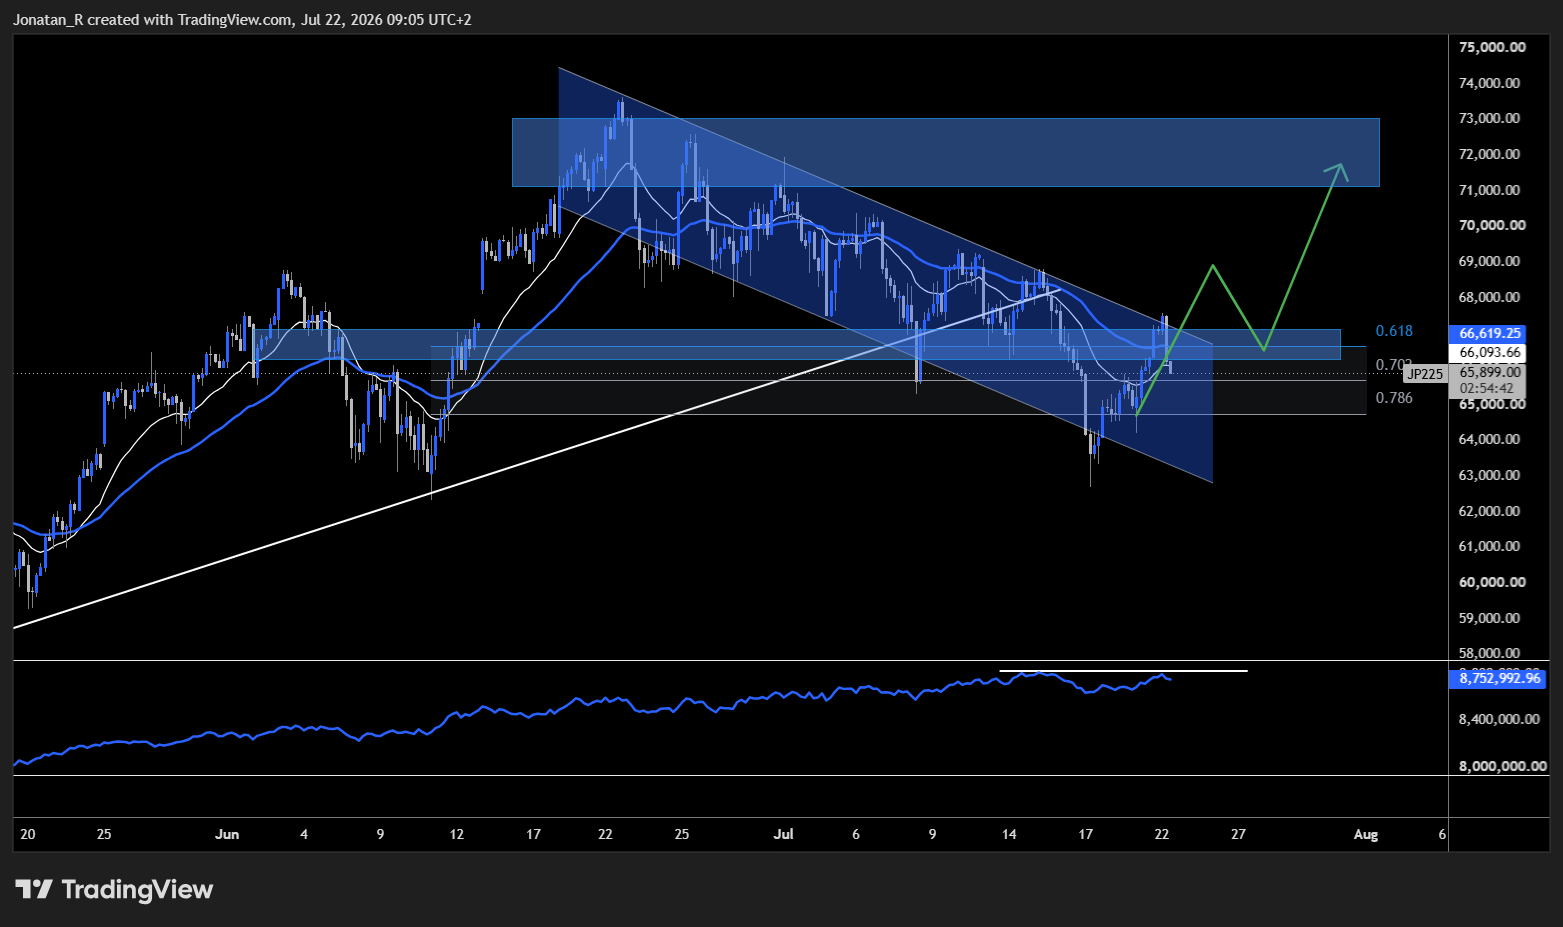
Nikkei 225 four-hour chart showing a bearish rejection at the 0.618 level with the accumulation/distribution line below.
On the 4H chart, we have just had a retest of the 0.618 level with a clear bearish rejection, which tells us this resistance zone is strong and that sellers are stepping in. Looking at the accumulation/distribution line in blue below, we do not yet have any breakout above the previous high formed around 15 July. If we can get a reclaim of the 0.618 with the accumulation/distribution indicator breaking out, we would have some signs of volume coming in and buyers supporting the move. For now, the 65,000 to 66,000 zone will likely act as support, unless a fresh catalyst comes in to push price lower.
Key levels to watch
- 0.618 retracement: the key level to reclaim on both the daily and 4H. A break above would clear the top of the local downtrend channel and open the path towards recovery.
- Reload zone (0.618 to 0.786): the area where support held as price approached the 64,000 level.
- Daily 20 and 50 EMA: currently overhead resistance, with a reclaim adding to the recovery signal.
- 65,000 to 66,000: the 4H support zone, likely to hold unless a fresh catalyst pushes price lower.
- All-time high region: the potential upside target if the recovery plays out.
Trading involves risk.
Author



 Risk Disclaimer
The content provided here is for informational purposes only. It is not intended as personal investment advice and does not constitute a solicitation or invitation to engage in any financial transactions, investments, or related activities. Past performance is not a reliable indicator of future results.
The financial products offered by the Company are complex and come with a high risk of losing money rapidly due to leverage. These products may not be suitable for all investors. Before engaging, you should consider whether you understand how these leveraged products work and whether you can afford the high risk of losing your money.
The Company does not accept clients from the Restricted Jurisdictions as indicated in our website/ T&C. Some services or products may not be available in your jurisdiction.
The applicable legal entity and its respective products and services depend on the client’s country of residence and the entity with which the client has established a contractual relationship during registration.