14 min read
 Polkadot (DOT) trades near $0.81 in early August 2026, roughly 98% below the record it set in the last bull market. DOT is the native token of Polkadot, a layer-0 network that lets separate blockchains plug into a shared relay chain, borrow its security, and pass messages to one another. The token pays for staking, on-chain governance votes, and the blockspace that connected chains consume. This page sets out PrimeXBT’s outlook for DOT through 2030 and out to 2050, the levels traders are watching right now, and the events that could move the price. The figures are our own estimates, written as bands instead of single points, and where a horizon is too distant to model honestly, we say so rather than inventing precision.
Polkadot outlook at a glance
- Current price: $1.248 per DOT.
- 2026 base case: $0.745–$0.971, an average near $0.85 — consolidation just above current levels, not a trend reversal.
- Main bullish catalyst: a broad alt-season rotation plus real traction for the JAM redesign and Agile Coretime, which would give DOT its own demand story rather than a Bitcoin echo.
- Biggest downside risk: DOT stays pinned below its 200-day average and loses the $0.78 support, extending the multi-year downtrend.
- Long-term view: a slow recovery is the base case as the new hard cap curbs supply growth, but anything past 2030 is a direction of travel, not a number to bank on.
Live Polkadot price chart
Today (11 October 2026) Polkadot (DOT/USD) is trading at $1.248 per DOT, with a market cap of $2,135,406,609 USD. The 24-hour trading volume amounts to $103,321,857 USD. DOT price has changed by -0.40% in the last 24 hours. Polkadot’s circulating supply is 1,706,893,515 DOT.
Trading involves risk.
Polkadot price prediction 2026–2030 (yearly forecast)
The table below gives our expected range for each year. The far more bullish long-horizon targets that circulate for DOT rest on assumptions we do not share, so they sit in the analyst section rather than being blended into these numbers.
| Year | Minimum | Average | Maximum |
|---|---|---|---|
| 2026 | $0.745 | $0.850 | $0.971 |
| 2027 | $0.836 | $1.092 | $1.404 |
| 2028 | $1.143 | $1.510 | $1.841 |
| 2029 | $0.991 | $1.331 | $1.731 |
| 2030 | $0.858 | $1.153 | $1.439 |
Polkadot price prediction 2026
Our 2026 outlook keeps DOT close to its early-August level, a band of $0.745–$0.971 averaging near $0.85. That places the token just above where it trades today and just below its 50-day average — a market catching its breath after a long slide, not one breaking out. The remaining months of the year run forward from the current price rather than re-forecasting the drop that already happened:
| Month (2026) | Minimum | Average | Maximum |
|---|---|---|---|
| August | $0.745 | $0.810 | $0.875 |
| September | $0.761 | $0.830 | $0.899 |
| October | $0.777 | $0.850 | $0.923 |
| November | $0.793 | $0.870 | $0.947 |
| December | $0.809 | $0.890 | $0.971 |
Polkadot price prediction 2027
2027 is the first genuine recovery year in our model. The path climbs off the 2026 base toward roughly a dollar, a full-year range of $0.836–$1.404 averaging near $1.10. The move leans on a warmer market for layer-1 and interoperability tokens rather than any single DOT headline, which is why it is gradual instead of vertical.
| Month (2027) | Minimum | Average | Maximum |
|---|---|---|---|
| January | $0.836 | $0.922 | $1.009 |
| February | $0.863 | $0.955 | $1.046 |
| March | $0.889 | $0.987 | $1.084 |
| April | $0.916 | $1.019 | $1.123 |
| May | $0.942 | $1.052 | $1.161 |
| June | $0.968 | $1.084 | $1.200 |
| July | $0.992 | $1.114 | $1.236 |
| August | $1.013 | $1.141 | $1.269 |
| September | $1.034 | $1.168 | $1.303 |
| October | $1.055 | $1.195 | $1.336 |
| November | $1.076 | $1.223 | $1.370 |
| December | $1.096 | $1.250 | $1.404 |
Polkadot price prediction 2028
2028 holds the peak of the cycle in our view. The path tops out near the middle of the year before cooling, giving a range of $1.143–$1.841 and an average near $1.50. If DOT is going to reclaim its 200-day average and hold it, this is the window where the outlook expects it.
| Month (2028) | Minimum | Average | Maximum |
|---|---|---|---|
| January | $1.143 | $1.307 | $1.471 |
| February | $1.189 | $1.364 | $1.539 |
| March | $1.234 | $1.421 | $1.607 |
| April | $1.280 | $1.478 | $1.675 |
| May | $1.325 | $1.535 | $1.744 |
| June | $1.370 | $1.592 | $1.813 |
| July | $1.383 | $1.612 | $1.841 |
| August | $1.365 | $1.595 | $1.826 |
| September | $1.346 | $1.579 | $1.812 |
| October | $1.328 | $1.563 | $1.797 |
| November | $1.310 | $1.546 | $1.782 |
| December | $1.292 | $1.530 | $1.768 |
Polkadot price prediction 2029
2029 is the give-back year after the peak, a measured drift lower across the twelve months. We put the range at $0.991–$1.731 with an average near $1.30 — softer than 2028, but still well clear of the 2026 lows.
| Month (2029) | Minimum | Average | Maximum |
|---|---|---|---|
| January | $1.258 | $1.495 | $1.731 |
| February | $1.225 | $1.459 | $1.694 |
| March | $1.191 | $1.424 | $1.657 |
| April | $1.158 | $1.388 | $1.619 |
| May | $1.125 | $1.353 | $1.582 |
| June | $1.092 | $1.318 | $1.544 |
| July | $1.067 | $1.293 | $1.518 |
| August | $1.052 | $1.278 | $1.504 |
| September | $1.037 | $1.264 | $1.491 |
| October | $1.021 | $1.249 | $1.477 |
| November | $1.006 | $1.235 | $1.463 |
| December | $0.991 | $1.220 | $1.449 |
Polkadot price prediction 2030
Our 2030 view settles into $0.858–$1.439, averaging near $1.15. Five years out, the model tracks a trajectory rather than a monthly schedule, so read the path below as the shape of a recovery that has matured, not a set of dated price targets.
| Month (2030) | Minimum | Average | Maximum |
|---|---|---|---|
| January | $0.979 | $1.209 | $1.439 |
| February | $0.967 | $1.198 | $1.430 |
| March | $0.955 | $1.188 | $1.420 |
| April | $0.943 | $1.177 | $1.410 |
| May | $0.932 | $1.166 | $1.401 |
| June | $0.920 | $1.155 | $1.391 |
| July | $0.909 | $1.145 | $1.382 |
| August | $0.899 | $1.136 | $1.374 |
| September | $0.888 | $1.127 | $1.366 |
| October | $0.878 | $1.118 | $1.358 |
| November | $0.868 | $1.109 | $1.350 |
| December | $0.858 | $1.100 | $1.342 |
Polkadot long-term price prediction: 2035, 2040–2050
Put a number on DOT in 2040 and you are really writing fiction with a decimal point. A decade absorbs technology shifts, governance decisions, and macro regimes that have not happened yet, and the JAM redesign alone could reshape what the network is for. Treat everything in this table as a rough upward drift whose error bars widen every year, supported mainly by the new hard cap slowing supply growth over time:
| Year | Minimum | Average | Maximum |
|---|---|---|---|
| 2035 | $1.258 | $1.700 | $2.142 |
| 2040 | $1.632 | $2.400 | $3.168 |
| 2050 | $2.280 | $3.800 | $5.320 |
What analysts and models say (compared)
Few coins split forecasters as cleanly as Polkadot does right now. Algorithmic aggregators, which extrapolate from the recent downtrend, mostly see DOT flat-to-lower into 2030; editorial forecasts betting on a full interoperability revival see multiples of today’s price. Averaging views built on opposite assumptions would only mislead, so they are laid out side by side.
| Source | Method | Polkadot view |
|---|---|---|
| CoinCodex | Algorithmic | ~$0.68 end-2026; ~$0.32 by 2030 (continued decline) |
| Changelly | Algorithmic | ~$0.82 avg 2026; ~$0.29 by 2030, with a later recovery toward ~$4.29 by 2050 |
| CryptoPredictions | Algorithmic | ~$1.18 avg 2026; ~$2.70 by 2030 |
| DigitalCoinPrice | Algorithmic | ~$0.68 end-2026; ~$0.32 by 2030 |
| Coinpedia | Editorial / fundamental | $2.50–$5.00 in 2026; $50–$60 by 2030 on full Polkadot 2.0 adoption |
The gap is the real signal. Three of the five algorithmic models expect DOT to keep bleeding toward $0.30 by 2030, while Coinpedia’s editorial case argues for $50–$60 — a sixty-fold move — if interoperability finally becomes the narrative that pulls capital in. Coinpedia is explicit that its top figure needs “structural adoption” of the Polkadot 2.0 stack to land at all. Our own numbers sit between the camps: more constructive than the pure-decline models, nowhere near the moonshot, and anchored to what the chart and the tokenomics actually support today.
Track record of this forecast
This is the first published PrimeXBT price forecast for Polkadot. From the next monthly review onward, this section will set the previous forecast against DOT’s actual price on the update date and account for any miss instead of quietly moving on.
Polkadot technical analysis
DOT sits below both of its most-watched moving averages, which is the plain definition of a downtrend still intact. It trades under its 50-day simple moving average of $0.85 and well under its 200-day average of $1.22, the line that has capped every rally attempt this year. The RSI reads near 49 — dead neutral, neither oversold enough to promise a bounce nor stretched enough to warn of one. The Fear & Greed Index sits at 29, in “Fear,” which fits a token that has spent the year grinding lower.
The support and resistance levels that matter now: support at $0.81, then $0.80, with a firmer floor near $0.78; resistance at $0.84, then a band around $0.86–$0.87. Reclaiming the 200-day average at $1.22 would be the first hard evidence that the multi-year decline has actually turned, and nothing below that level changes the bigger picture. For a primer on reading these signals, see PrimeXBT’s guide to crypto technical analysis.
Correlation with other assets
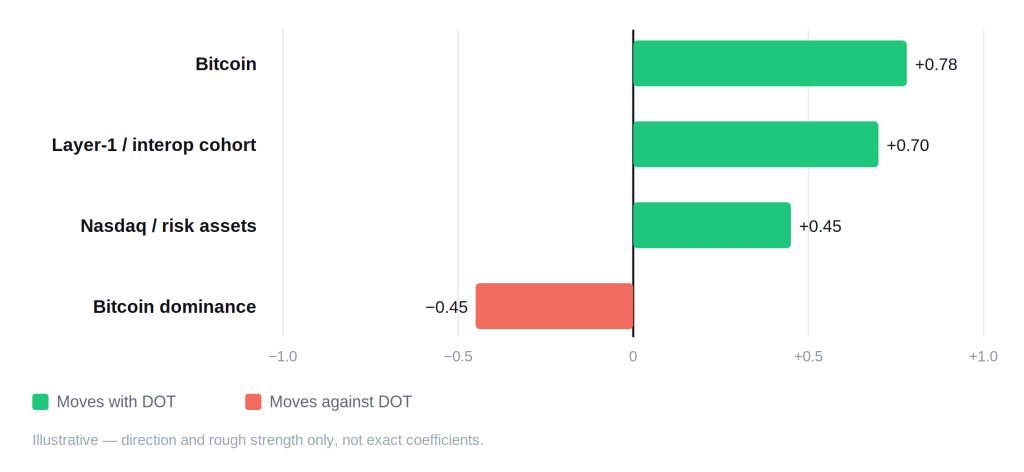
Polkadot trades as a high-beta bet on Bitcoin with almost none of the upside capture. When Bitcoin rallies, DOT tends to follow; when Bitcoin merely wobbles, DOT often falls harder, and it has spent this cycle lagging the majors rather than leading them. Its tightest relationship is with Bitcoin dominance: as capital concentrates in Bitcoin, layer-1 and interoperability tokens like DOT lose ground, and only a rotation out of Bitcoin into alts has reliably lifted it. Since institutions arrived, DOT has also tracked risk assets such as the Nasdaq, so Federal Reserve policy now reaches its price quickly. What separates Polkadot from a pure Bitcoin proxy is its sensitivity to its own plumbing — parachain activity, coretime demand, and headlines around the JAM upgrade can move DOT even on a quiet day for the wider market. None of these links is fixed; they tighten and loosen as the market’s mood changes.
Fundamental factors
Polkadot is a “blockchain of blockchains.” Instead of hosting applications directly, its central relay chain provides shared security to the specialized chains that connect to it, so a new project can launch without bootstrapping its own validator set and can still message every other chain in the network. The project was created by Gavin Wood, an Ethereum co-founder who coined the term “Web3,” and is stewarded by the Web3 Foundation and Parity Technologies. The network runs on Nominated Proof-of-Stake: holders nominate validators, roughly 53% of circulating DOT is staked, and stakers currently earn in the region of 9–12% a year.
Two structural shifts define Polkadot in 2026. The first is Agile Coretime, now live, which replaced the old parachain slot auctions — projects no longer lock up large sums of DOT to win a multi-year lease and instead buy blockspace in bulk or as they go, a friendlier model for smaller teams. The second is tokenomics. On March 14, 2026, a governance vote activated a fixed cap of 2.1 billion DOT, ending the network’s open-ended issuance; net inflation dropped from around 10% to roughly 3.11% and falls further on a disinflationary schedule from here. Circulating supply sits near 1.66–1.70 billion DOT, so the cap leaves limited room for new issuance over the coming years — a meaningful change for a token whose old model printed fresh DOT every block. The larger open question is JAM, the Join-Accumulate Machine, an ambitious re-architecture of how the network computes. JAM is not live on mainnet, and the Web3 Foundation is funding competing implementations through a prize pool, so it reads as a multi-year bet rather than a shipped product. On-chain governance runs through OpenGov, where DOT holders decide upgrades and treasury spending directly.
Upcoming catalysts
Only confirmed, dated events are listed. With DOT trading so closely to broad risk sentiment, macro policy is the clearest near-term driver.
| Date | Event | Potential impact |
|---|---|---|
| September 15–16, 2026 | FOMC meeting (with economic projections) | Bull if the Fed signals cuts; bear if it holds rates higher for longer |
| October 27–28, 2026 | FOMC meeting | Rate path steers risk appetite across the alt market, where DOT sits |
| December 8–9, 2026 | FOMC meeting (with economic projections) | Year-end policy signal for 2027 positioning |
| 2026–2027 (date not confirmed) | JAM upgrade progress on mainnet | A DOT-specific demand story if it ships; no mainnet date announced yet |
FOMC dates follow the Federal Reserve’s published 2026 schedule. JAM is listed without a date because none has been set — an invented timeline would be a guess, not information.
Bull case vs bear case
Bull case:
- Capital rotates out of Bitcoin into alts, and DOT’s high beta finally works in its favor.
- The 2.1 billion hard cap and falling inflation thin out the steady sell pressure that dogged the old model.
- Agile Coretime pulls more builders onto the network, turning blockspace demand into real DOT demand.
- JAM ships and gives Polkadot a story of its own instead of a Bitcoin shadow.
Bear case:
- Bitcoin dominance stays high, and alts including DOT keep bleeding.
- DOT never reclaims its 200-day average and the downtrend simply continues.
- JAM slips further, and the interoperability narrative loses whatever attention it has left.
- Buyers fail to defend $0.78 and the market probes for a new floor beneath it.
Invalidation levels. The bull case weakens if DOT closes below the $0.78 floor, its last clear support before open air. The bear case is invalidated on a sustained break above the $0.86–$0.87 resistance and, decisively, on a reclaim of the 200-day average at $1.22 — roughly 50% above the current price, and the level that would mark the long decline as broken. The nearer downside trigger, $0.78, sits only a few percent below spot, which is what makes the current range so tight.
Historical performance
Polkadot’s chart is a study in a single, unfinished bear market. DOT launched in 2020, ran to an all-time high of $54.98 on November 4, 2021, and has spent the years since giving almost all of it back — the token now sits close to 98% below that peak. Unlike Bitcoin or Ethereum, DOT has not built a higher low across cycles; each recovery attempt has stalled under the previous one. Any forecast that calls for a rebound is implicitly calling for that pattern to break.
Is Polkadot a good investment in 2026?
Polkadot in 2026 is a wager on a specific thing: that shared-security interoperability becomes a narrative the market pays for, and that the JAM redesign and a fixed supply cap are enough to reverse a multi-year downtrend. Our outlook sees DOT roughly flat into year-end, averaging near $0.85, with the recovery arriving later in the cycle if it arrives at all. The facts are mixed by design — sentiment is fearful, the price sits below its long-term average, but supply growth is now capped and the technology roadmap is still live. Whether that balance reads as an entry or a value trap comes down to how much patience a position can carry. PrimeXBT’s explainer on whether Polkadot is a good investment works through the case in more detail.
How to trade Polkadot on PrimeXBT
On PrimeXBT you can take a position on Polkadot in either direction. CFDs on DOT can be traded long or short, so a falling price is as tradable as a rising one — see PrimeXBT’s guide to short selling for how the downside side works. Leverage magnifies gains and losses alike, so position sizing and a stop-loss matter on every trade. Trade on your own analysis and risk tolerance, and never risk more than you can afford to lose. For background on the network itself, PrimeXBT’s guide to what Polkadot is covers the fundamentals.
Trading involves risk.
How we build this forecast
This outlook is assembled by PrimeXBT’s analysts, not copied from a single price feed. We start from where DOT trades today, read its position against the 50- and 200-day moving averages and the support and resistance levels that are holding, weigh the fundamentals — the new supply cap, staking participation, Agile Coretime, and the JAM roadmap — and set all of it against the macro backdrop, chiefly the path of U.S. interest rates. The yearly bands combine that technical read with the fundamental and macro picture; the long-range figures lean on trajectory rather than precision.
None of this is a guarantee. Crypto is volatile, the inputs change, and a single macro or protocol surprise can move DOT faster than any model expects. Treat every figure here as a considered estimate rather than a promise — we revisit and update the outlook monthly as the data moves.
How much will Polkadot be worth in 2026?
Our outlook averages near $0.85 for 2026, close to where DOT trades now — a year of consolidation rather than a breakout.
How much will Polkadot be worth in 2030?
Our long-range view averages near $1.15 for 2030. Forecasts this far out carry a wide margin of error, so treat the number as a direction rather than a target.
Can Polkadot reach $100?
Not on our numbers. DOT would need to climb more than a hundredfold from current levels, and the top of our modeled range through 2030 sits well under $2. Reaching $100 would require a cycle far stronger than anything the current picture supports.
Is Polkadot a good investment in 2026?
It is a mixed picture. Sentiment is fearful and the price sits below its long-term average, but supply growth is now capped and the roadmap is still active. The case runs both ways and depends heavily on how long a position can wait for the interoperability narrative to pay off.
When is the next major Polkadot upgrade?
The most recent structural change was the March 14, 2026 activation of the 2.1 billion DOT hard cap. The next big milestone is JAM, the Join-Accumulate Machine, which is not yet live on mainnet and has no confirmed launch date.
Author



 Risk Disclaimer
The content provided here is for informational purposes only. It is not intended as personal investment advice and does not constitute a solicitation or invitation to engage in any financial transactions, investments, or related activities. Past performance is not a reliable indicator of future results.
The financial products offered by the Company are complex and come with a high risk of losing money rapidly due to leverage. These products may not be suitable for all investors. Before engaging, you should consider whether you understand how these leveraged products work and whether you can afford the high risk of losing your money.
The Company does not accept clients from the Restricted Jurisdictions as indicated in our website/ T&C. Some services or products may not be available in your jurisdiction.
The applicable legal entity and its respective products and services depend on the client’s country of residence and the entity with which the client has established a contractual relationship during registration.