13 min read
 The Graph (GRT) trades near $0.018 in late August 2026, roughly 99% below its 2021 record and close to the all-time low it printed earlier this year. The Graph is a decentralized protocol that indexes and queries blockchain data through open APIs called subgraphs, a job often summed up as “the Google of blockchains”; GRT is the token that pays for and secures that work, staked by indexers, allocated by delegators, and signaled by curators. This page lays out PrimeXBT’s price outlook for GRT through 2030 and out to 2050, the levels traders are watching now, and the roadmap and macro events that could shift the picture. Figures appear as ranges rather than single points, and where the evidence is thin, the text says so plainly.
The Graph outlook at a glance
- 2026 base case: $0.0165–$0.0205, a bottoming range rather than a fresh trend, averaging near $0.0182.
- Main bullish catalyst: the Horizon upgrade and The Graph’s 2026 push into AI data services, paired with a broader alt-market recovery as the Fed eases.
- Biggest downside risk: query revenue and indexer demand stay soft while GRT loses the $0.0144 support, opening the door to the deeper Fibonacci zone near $0.0051.
- Long-term view: a slow grind higher is the base case, but any figure past 2030 is a direction of travel, not a target you can set a stop against.
Live The Graph price chart
The chart below tracks GRT in real time; the levels that matter right now are broken out in the technical section further down. GRT/USD is not currently listed for trading on PrimeXBT.
Trading involves risk.
The Graph price prediction 2026–2030 (yearly forecast)
The table sets PrimeXBT’s expected range for each year. Third-party algorithmic models that extrapolate the current downtrend, and older editorial targets still anchored to a higher-price era, diverge sharply from this and from each other; those sit in the analyst section rather than getting blended in here.
| Year | Minimum | Average | Maximum |
|---|---|---|---|
| 2026 | $0.0165 | $0.0183 | $0.0205 |
| 2027 | $0.0185 | $0.0268 | $0.0379 |
| 2028 | $0.0312 | $0.0398 | $0.0484 |
| 2029 | $0.0253 | $0.0338 | $0.0439 |
| 2030 | $0.0217 | $0.0291 | $0.0365 |
The Graph price prediction 2026
PrimeXBT’s 2026 outlook keeps GRT near its late-August level of $0.018, a range of roughly $0.0165–$0.0205 that averages near $0.0182. After a year that carried GRT to a new all-time low, that reads as a floor forming, not a recovery underway.
Across the rest of 2026, the month-by-month view holds GRT in a narrow, slightly firming band, an August average near $0.0177 edging toward roughly $0.0188 by December:
| Month (2026) | Minimum | Average | Maximum |
|---|---|---|---|
| August | $0.0165 | $0.0177 | $0.0189 |
| September | $0.0166 | $0.0180 | $0.0193 |
| October | $0.0168 | $0.0182 | $0.0196 |
| November | $0.0171 | $0.0186 | $0.0201 |
| December | $0.0175 | $0.0190 | $0.0205 |
The Graph price prediction 2027
2027 is where the outlook turns constructive: the path lifts from the high-$0.01s early in the year toward the low-$0.03s by December, a full-year range of about $0.0185–$0.0379 averaging near $0.0265. The step up leans on the network converting its AI and data-service work into paid query demand, not on a single announcement.
| Month (2027) | Minimum | Average | Maximum |
|---|---|---|---|
| January | $0.0185 | $0.0202 | $0.0219 |
| February | $0.0194 | $0.0213 | $0.0232 |
| March | $0.0204 | $0.0225 | $0.0245 |
| April | $0.0214 | $0.0236 | $0.0258 |
| May | $0.0224 | $0.0248 | $0.0271 |
| June | $0.0234 | $0.0259 | $0.0285 |
| July | $0.0244 | $0.0272 | $0.0299 |
| August | $0.0256 | $0.0285 | $0.0315 |
| September | $0.0267 | $0.0299 | $0.0331 |
| October | $0.0278 | $0.0313 | $0.0347 |
| November | $0.0289 | $0.0326 | $0.0363 |
| December | $0.0301 | $0.0340 | $0.0379 |
The Graph price prediction 2028
2028 holds the cycle high in this outlook: GRT peaks mid-year before easing back, for a range of about $0.0312–$0.0484 and an average near $0.0398. That places the next cyclical top for GRT in this window, in step with the broader post-halving market rather than ahead of it.
| Month (2028) | Minimum | Average | Maximum |
|---|---|---|---|
| January | $0.0312 | $0.0354 | $0.0396 |
| February | $0.0323 | $0.0368 | $0.0413 |
| March | $0.0334 | $0.0382 | $0.0429 |
| April | $0.0345 | $0.0395 | $0.0446 |
| May | $0.0356 | $0.0409 | $0.0463 |
| June | $0.0367 | $0.0423 | $0.0480 |
| July | $0.0368 | $0.0426 | $0.0484 |
| August | $0.0361 | $0.0419 | $0.0477 |
| September | $0.0353 | $0.0412 | $0.0470 |
| October | $0.0346 | $0.0405 | $0.0463 |
| November | $0.0339 | $0.0397 | $0.0456 |
| December | $0.0331 | $0.0390 | $0.0449 |
The Graph price prediction 2029
2029 cools off after the peak. The path drifts lower through the year, ranging about $0.0253–$0.0439 with an average near $0.0330, the familiar giveback that follows a cyclical top rather than a return to the lows.
| Month (2029) | Minimum | Average | Maximum |
|---|---|---|---|
| January | $0.0322 | $0.0381 | $0.0439 |
| February | $0.0313 | $0.0372 | $0.0430 |
| March | $0.0305 | $0.0362 | $0.0420 |
| April | $0.0296 | $0.0353 | $0.0410 |
| May | $0.0287 | $0.0344 | $0.0401 |
| June | $0.0278 | $0.0335 | $0.0391 |
| July | $0.0272 | $0.0328 | $0.0384 |
| August | $0.0268 | $0.0325 | $0.0381 |
| September | $0.0264 | $0.0321 | $0.0378 |
| October | $0.0260 | $0.0317 | $0.0374 |
| November | $0.0256 | $0.0314 | $0.0371 |
| December | $0.0253 | $0.0310 | $0.0367 |
The Graph price prediction 2030
PrimeXBT’s 2030 view spans roughly $0.0217–$0.0365, averaging near $0.0290. Half a decade out, the outlook rests on trajectory more than any single print, so treat the monthly path below as a slope, not a schedule of dated prices.
| Month (2030) | Minimum | Average | Maximum |
|---|---|---|---|
| January | $0.0249 | $0.0307 | $0.0365 |
| February | $0.0246 | $0.0304 | $0.0362 |
| March | $0.0242 | $0.0301 | $0.0359 |
| April | $0.0239 | $0.0298 | $0.0356 |
| May | $0.0236 | $0.0295 | $0.0353 |
| June | $0.0232 | $0.0292 | $0.0351 |
| July | $0.0230 | $0.0289 | $0.0348 |
| August | $0.0227 | $0.0287 | $0.0346 |
| September | $0.0224 | $0.0285 | $0.0345 |
| October | $0.0222 | $0.0282 | $0.0343 |
| November | $0.0219 | $0.0280 | $0.0341 |
| December | $0.0217 | $0.0278 | $0.0339 |
The Graph long-term price prediction: 2035, 2040–2050
Push the horizon past 2030 and precision quietly disappears. No model prices a decade of network re-architectures, AI adoption curves, and interest-rate regimes that haven’t happened yet, so the numbers below describe a gentle upward drift rather than destinations, with the uncertainty widening every year out. Even at the top of this range, GRT would sit far below its old record:
| Year | Minimum | Average | Maximum |
|---|---|---|---|
| 2035 | $0.0244 | $0.0330 | $0.0416 |
| 2040 | $0.0306 | $0.0450 | $0.0594 |
| 2050 | $0.0408 | $0.0680 | $0.0952 |
What analysts and models say (compared)
Few tokens split forecasters as cleanly as GRT does right now. Current-calibrated algorithmic models read the chart and extend the downtrend, projecting further declines into 2030. Several editorial aggregators still publish targets in the dollar range, figures that made sense when GRT traded above $0.15 but look detached from a sub-$0.02 spot price. Averaging the two camps would produce a number that describes neither, so they are laid out side by side.
| Source | Method | The Graph view |
|---|---|---|
| CoinCodex | Algorithmic | Bearish: 2026 avg ~$0.013 declining toward ~$0.003 by 2030 |
| Changelly | Algorithmic | Bearish: 2026 avg ~$0.016 declining toward ~$0.005 by 2030 |
| Coinpedia | Editorial | Bullish: 2026 avg near $1.20, rising through 2030 (targets predate the recent decline) |
| DigitalCoinPrice | Algorithmic | Bullish: 2026 range around $0.48–$0.59 (calibrated to a 2024 price above $0.15) |
| PrimeXBT | Synthesis | Modest cyclical recovery: ~$0.018 in 2026, peak near $0.038 in 2028, easing after |
The gap is the point. Pure trend-extrapolation models see a token bleeding toward fractions of a cent; the dollar-target crowd never reset after GRT fell through its old range. PrimeXBT’s view sits between them, a token deeply discounted and oversold, with a credible roadmap, capable of a cyclical bounce, but nowhere near the multi-dollar recovery some pages still imply. No single figure here counts as consensus, and pretending one does would mislead.
Track record of this forecast
This is the first GRT price outlook PrimeXBT has published. Starting with the next monthly review, this section will hold the previous forecast up against GRT’s actual price on the update date and account for any miss instead of quietly revising it away.
The Graph technical analysis
As of publication, GRT sits between its two headline moving averages. It trades above the 50-day simple moving average near $0.0162, a sign it has clawed back from the mid-August lows, but below the 200-day average near $0.0229, which keeps the longer trend pointed down. The RSI sank into oversold territory near 26 in mid-August before the price recovered, and the Fear & Greed Index reads 34, or Fear.
The support and resistance levels in play now: support at $0.0144, then $0.0114, with a deeper Fibonacci demand zone around $0.0051 if selling accelerates; resistance at $0.0163, then the round $0.0200 mark. Reclaiming the 200-day average at $0.0229 would be the cleanest evidence the multi-month downtrend has actually broken. For readers new to these tools, PrimeXBT’s guide to crypto technical analysis walks through how the signals fit together.
Correlation with other assets
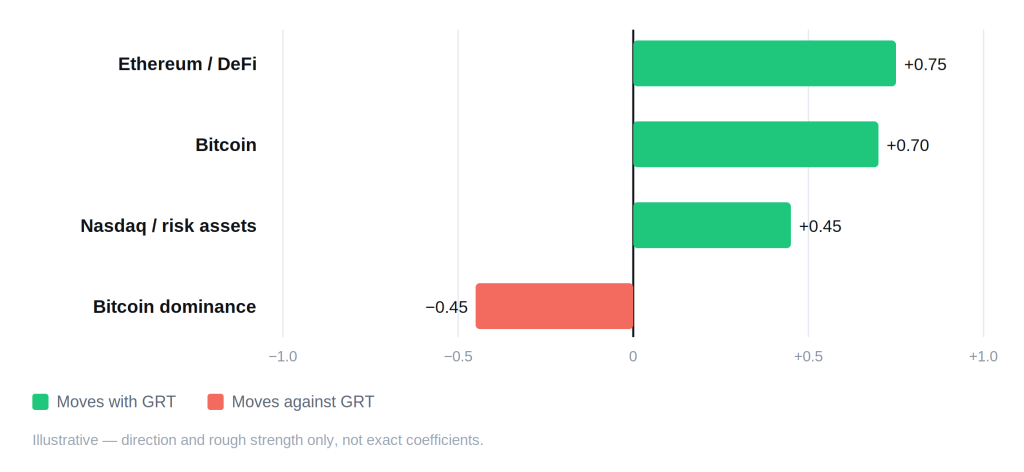
GRT trades first and foremost as an Ethereum-ecosystem token. Its roots are in indexing Ethereum data, most of its usage sits in DeFi and Web3 applications, and it tends to rise and fall with the wider decentralized-finance basket more tightly than with Bitcoin alone. It still tracks Bitcoin’s larger swings, since Bitcoin sets the tone for the whole market, and it has grown more sensitive to the Bitcoin dominance reading, capital rotating into Bitcoin tends to drain small-cap alts like GRT first. Against risk assets such as the Nasdaq, the link has firmed as macro liquidity drives crypto, which is why Fed decisions now show up quickly in GRT’s price. One quirk sets GRT apart: its AI and data-service narrative can briefly decouple it from the pack when that theme is in favor, a lever most infrastructure tokens lack. None of these relationships are fixed, and they loosen or tighten as the market’s focus moves.
Fundamental factors
The Graph runs a two-sided data market. Indexers stake GRT to process and serve queries, delegators back indexers with their own GRT to earn a share of rewards, and curators signal which subgraphs deserve indexing. Demand for the token ultimately rides on query volume, how much real usage the network’s data feeds attract. GRT carries no hard cap: indexing rewards issue at roughly 3% a year, reviewable down toward zero by governance, while about 1% of query fees and protocol taxes are burned, leaving net issuance modestly positive. Circulating supply now stands near 10.94 billion GRT.
The Horizon upgrade, live since December 2025, re-architected the protocol from a subgraph-only service into a broader data-infrastructure platform with unified staking and permissionless new services. The 2026 roadmap leans hard into machine consumers: Substreams for real-time streaming, a Token API covering roughly 10 chains, and an x402 payment path that lets AI agents query the network and pay per request without manual setup. Natural-language access through assistants like Claude and ChatGPT points the network at a different customer than the developers who built early subgraphs. Whether that broadens paying demand enough to lift a token trading near its lows is the open question underneath every price scenario here, and it will not be settled by a single release.
Upcoming catalysts
Only confirmed, dated events are listed. With GRT now moving alongside risk assets, macro policy is the clearest near-term driver.
| Date | Event | Potential impact |
|---|---|---|
| September 15–16, 2026 | FOMC meeting (with economic projections) | Bull if the Fed signals cuts; bear if it holds rates higher for longer |
| October 27–28, 2026 | FOMC meeting | Rate path steers risk appetite across small-cap alts |
| December 8–9, 2026 | FOMC meeting (with economic projections) | Year-end policy signal that frames 2027 positioning |
| 2026 (date not yet confirmed) | Continued Horizon rollout and 2026 data-service releases | Adoption of AI query services could lift paid demand for GRT; no fixed mainnet dates announced |
FOMC dates follow the Federal Reserve’s published 2026 schedule. The Graph’s roadmap items appear without dates because none have been confirmed, and an invented date would be a guess dressed as information.
Bull case vs bear case
Bull case:
- AI agents and enterprise data services turn into recurring, paid query demand for the network.
- The Fed eases and capital rotates back down the risk curve into small-cap alts, GRT among them.
- GRT is oversold and near record lows, so a modest shift in sentiment moves it more than it would a large-cap.
- Governance keeps issuance low while burns rise, tightening net supply as usage grows.
Bear case:
- Query revenue stays thin and the AI-services pitch fails to convert into token demand.
- Bitcoin dominance keeps climbing, and liquidity drains out of small-cap alts.
- Competing indexing and RPC providers erode The Graph’s share of the data-infrastructure market.
- GRT loses the $0.0144 support and slides toward the deeper Fibonacci zone near $0.0051.
Invalidation levels. The bull case weakens if GRT closes below $0.0144, the nearest support. The bear case is invalidated on a sustained break back above $0.0200 and, more convincingly, a reclaim of the 200-day average at $0.0229, roughly 29% above the late-August price and the line that would confirm the downtrend has snapped. The downside trigger at $0.0144 sits about 19% below spot.
Historical performance
GRT launched in December 2020 and spiked to $2.88 by February 2021, then spent the following years grinding down through every bounce, printing a fresh all-time low near $0.023 in early 2026. The chart is a long deflation from a hype-cycle top, not a series of higher lows. A token this far below its record has more room to rally in percentage terms, and more room to keep bleeding, so the starting point cuts both ways.
Is The Graph a good investment in 2026?
GRT is a bet on one specific thesis: that decentralized indexing, now repositioned around AI and enterprise data, becomes infrastructure the market pays for. PrimeXBT’s outlook sees GRT roughly flat into year-end, averaging near $0.0182, with a possible cyclical recovery only building in 2027 and beyond. The token is cheap against its history, oversold, and backed by a live roadmap, but it is also a small-cap trading near its lows with soft revenue and real competition. Whether that combination reads as a discounted option or a value trap depends on how much weight a reader gives the AI-data narrative actually paying off.
How to trade The Graph on PrimeXBT
PrimeXBT lets traders take positions on a broad range of crypto markets in either direction. CFDs can be traded long or short, so a view on a token can be expressed whichever way the analysis points, without holding the underlying coin. Leverage magnifies gains and losses alike, which makes position sizing and a stop-loss part of any serious plan. Trade on your own analysis and risk tolerance, and never risk more than you can afford to lose.
Trading involves risk.
How we build this forecast
PrimeXBT’s analysts assemble this outlook rather than copying it from one price feed. The starting point is where GRT trades today, read against its 50- and 200-day moving averages and the support and resistance levels that traders are actually defending. On top of that sits the fundamental read, indexer and query demand, the Horizon upgrade, the AI-data roadmap, issuance and burns, and the macro backdrop, chiefly the path of U.S. interest rates and where capital sits on the risk curve. The yearly ranges fold that technical picture into the fundamental and macro view; the long-range figures lean on trajectory over precision.
None of this is a promise. GRT is a small-cap token, its inputs move fast, and one macro shock or one roadmap surprise can push it further than any model expects. Read every figure here as a considered estimate, not a guarantee, revisited and updated monthly as the data changes.
How much will The Graph be worth in 2026?
PrimeXBT's outlook is roughly $0.0165–$0.0205 for 2026, averaging near $0.0182.
How much will The Graph be worth in 2030?
The long-range view is roughly $0.0217–$0.0365, averaging near $0.0290. On a five-year horizon, treat any single figure as a direction rather than a target.
What will The Graph be worth in five years?
See 2030 above. The modeled average is near $0.0290, but the plausible band is wide and the number describes a slope, not a fixed price on a fixed date.
Can The Graph reach $1?
Not on these numbers. The 2028 cycle peak tops out near $0.046, and even the long-range 2050 average stays below $0.10. Returning to $1 would take a far stronger cycle and far more paid network usage than the current picture supports.
When did The Graph reach its all-time high?
GRT hit its record of $2.88 on February 12, 2021, and trades roughly 99% below that today.
Author



 Risk Disclaimer
The content provided here is for informational purposes only. It is not intended as personal investment advice and does not constitute a solicitation or invitation to engage in any financial transactions, investments, or related activities. Past performance is not a reliable indicator of future results.
The financial products offered by the Company are complex and come with a high risk of losing money rapidly due to leverage. These products may not be suitable for all investors. Before engaging, you should consider whether you understand how these leveraged products work and whether you can afford the high risk of losing your money.
The Company does not accept clients from the Restricted Jurisdictions as indicated in our website/ T&C. Some services or products may not be available in your jurisdiction.
The applicable legal entity and its respective products and services depend on the client’s country of residence and the entity with which the client has established a contractual relationship during registration.