
 14 min read
 XDC Network (XDC) trades near $0.030 in late August 2026, roughly 85% below the record high it set in August 2021. XDC is the native token of the XDC Network, an enterprise-grade layer-1 blockchain built for trade finance and the tokenization of real-world assets. Launched in 2019 by the XinFin team, the network runs a delegated-proof-of-stake consensus called XDPoS, stays compatible with the Ethereum Virtual Machine, and aligns its messaging standards with ISO 20022, the format banks use for cross-border payments. This page sets out PrimeXBT’s price outlook for XDC through 2030 and out to 2050, the levels traders are watching now, and the catalysts that could move it. Every projection here is a band, not a decimal-point promise, and the sections flag which horizons rest on firm data and which lean on trajectory.
XDC Network outlook at a glance
- 2026 base case: $0.029–$0.035, a year of consolidation near current levels rather than a breakout.
- Main bullish catalyst: institutional real-world-asset tokenization moving onto XDC, paired with a friendlier macro backdrop as the Fed eases.
- Biggest downside risk: RWA adoption stays a promise rather than volume, and XDC loses its $0.027 support on a sustained basis.
- Long-term view: the trajectory bends higher into the late 2020s, but any figure past 2030 is a direction of travel, not a dated target.
Live XDC price chart
The live chart below tracks XDC Network in real time; the levels that matter right now are set out in the technical section further down. XDC/USD is the pair to watch.
Trading involves risk.
XDC Network price prediction 2026–2030 (yearly forecast)
The table sets PrimeXBT’s expected range for each year, built from a single continuous monthly path rather than five stand-alone guesses. The wide, incompatible targets floating around the market — some algorithmic, some promotional — are kept out of this table and dealt with separately in the analyst section below.
| Year | Minimum | Average | Maximum |
|---|---|---|---|
| 2026 | $0.0276 | $0.0319 | $0.0366 |
| 2027 | $0.0318 | $0.0459 | $0.0659 |
| 2028 | $0.0510 | $0.0641 | $0.0782 |
| 2029 | $0.0418 | $0.0567 | $0.0721 |
| 2030 | $0.0366 | $0.0512 | $0.0649 |
XDC Network price prediction 2026
PrimeXBT’s 2026 outlook holds XDC close to its late-August level near $0.030, a full-year range of $0.0276–$0.0366 averaging near $0.032. That is a coin marking time: enough of a floor to suggest the worst of the drawdown is behind it, not enough of a catalyst to force a trend. The token has clawed back above its 50-day average but has yet to prove it can hold above the longer one.
For the remainder of 2026, the month-by-month path drifts gently higher, from an August average near $0.030 toward roughly $0.033 by December:
| Month (2026) | Minimum | Average | Maximum |
|---|---|---|---|
| August | $0.0276 | $0.0300 | $0.0324 |
| September | $0.0284 | $0.0310 | $0.0336 |
| October | $0.0292 | $0.0320 | $0.0348 |
| November | $0.0298 | $0.0328 | $0.0357 |
| December | $0.0304 | $0.0335 | $0.0366 |
XDC Network price prediction 2027
2027 is the recovery leg. PrimeXBT’s path climbs from the low $0.030s early in the year toward the mid-$0.050s by December, a full-year range of $0.0318–$0.0659 averaging near $0.045. The step up leans on tokenization pipelines converting into on-chain volume rather than on a single announcement, and it assumes the broader risk-asset backdrop stays constructive.
| Month (2027) | Minimum | Average | Maximum |
|---|---|---|---|
| January | $0.0318 | $0.0353 | $0.0387 |
| February | $0.0333 | $0.0370 | $0.0408 |
| March | $0.0348 | $0.0388 | $0.0429 |
| April | $0.0362 | $0.0406 | $0.0449 |
| May | $0.0376 | $0.0423 | $0.0471 |
| June | $0.0391 | $0.0441 | $0.0492 |
| July | $0.0407 | $0.0462 | $0.0516 |
| August | $0.0426 | $0.0485 | $0.0544 |
| September | $0.0445 | $0.0509 | $0.0573 |
| October | $0.0464 | $0.0533 | $0.0601 |
| November | $0.0483 | $0.0556 | $0.0630 |
| December | $0.0501 | $0.0580 | $0.0659 |
XDC Network price prediction 2028
2028 carries the cycle high in this outlook. The path peaks around mid-year near $0.068 before easing back, for a full-year range of $0.0510–$0.0782 and an average near $0.064. XDC roughly doubling off its 2026 base fits an enterprise-chain re-rating, not a meme-style vertical, and the give-back into the back half of the year is deliberate rather than an afterthought.
| Month (2028) | Minimum | Average | Maximum |
|---|---|---|---|
| January | $0.0513 | $0.0595 | $0.0678 |
| February | $0.0524 | $0.0611 | $0.0698 |
| March | $0.0535 | $0.0626 | $0.0717 |
| April | $0.0546 | $0.0642 | $0.0737 |
| May | $0.0557 | $0.0657 | $0.0757 |
| June | $0.0567 | $0.0672 | $0.0777 |
| July | $0.0567 | $0.0675 | $0.0782 |
| August | $0.0555 | $0.0664 | $0.0772 |
| September | $0.0544 | $0.0653 | $0.0761 |
| October | $0.0533 | $0.0642 | $0.0751 |
| November | $0.0521 | $0.0631 | $0.0740 |
| December | $0.0510 | $0.0620 | $0.0730 |
XDC Network price prediction 2029
2029 is the cool-down. After the 2028 top, the path settles into a gentle decline across the year, a range of $0.0418–$0.0721 averaging near $0.056. Post-peak years rarely hold the high, and the outlook builds that fade in rather than pretending the top becomes a floor.
| Month (2029) | Minimum | Average | Maximum |
|---|---|---|---|
| January | $0.0501 | $0.0611 | $0.0721 |
| February | $0.0491 | $0.0602 | $0.0712 |
| March | $0.0481 | $0.0592 | $0.0703 |
| April | $0.0472 | $0.0583 | $0.0694 |
| May | $0.0462 | $0.0574 | $0.0685 |
| June | $0.0453 | $0.0565 | $0.0676 |
| July | $0.0446 | $0.0558 | $0.0670 |
| August | $0.0440 | $0.0553 | $0.0666 |
| September | $0.0434 | $0.0549 | $0.0663 |
| October | $0.0429 | $0.0544 | $0.0659 |
| November | $0.0424 | $0.0540 | $0.0656 |
| December | $0.0418 | $0.0535 | $0.0652 |
XDC Network price prediction 2030
PrimeXBT’s 2030 view spans $0.0366–$0.0649, averaging near $0.051. This far out the numbers describe a shape, not a schedule, so read the monthly path below as the slope of the trend rather than a set of dated prices.
| Month (2030) | Minimum | Average | Maximum |
|---|---|---|---|
| January | $0.0413 | $0.0531 | $0.0649 |
| February | $0.0408 | $0.0527 | $0.0646 |
| March | $0.0404 | $0.0523 | $0.0643 |
| April | $0.0399 | $0.0520 | $0.0640 |
| May | $0.0394 | $0.0516 | $0.0637 |
| June | $0.0389 | $0.0512 | $0.0634 |
| July | $0.0385 | $0.0509 | $0.0632 |
| August | $0.0381 | $0.0506 | $0.0630 |
| September | $0.0378 | $0.0503 | $0.0629 |
| October | $0.0374 | $0.0500 | $0.0627 |
| November | $0.0370 | $0.0498 | $0.0625 |
| December | $0.0366 | $0.0495 | $0.0624 |
XDC Network long-term price prediction: 2035, 2040–2050
Push the horizon past 2030 and precision collapses. A decade of the network either winning real trade-finance flows or failing to, of shifting regulation, and of macro cycles nobody can name yet, sits between here and 2050 — so the figures below map a rough incline, not destinations, and the error bars only widen with each year. On that understanding, PrimeXBT’s long-range path grinds upward without ever going parabolic:
| Year | Minimum | Average | Maximum |
|---|---|---|---|
| 2035 | $0.0525 | $0.0750 | $0.0975 |
| 2040 | $0.0704 | $0.1100 | $0.1496 |
| 2050 | $0.0952 | $0.1700 | $0.2448 |
What analysts and models say (compared)
XDC forecasts sit unusually far apart, which is the honest headline. For 2026, conservative algorithmic models cluster in the low $0.030s to mid-$0.050s, while more bullish takes reach into the $0.13 area; for 2030 the spread runs from roughly $0.08 to above $0.50. Blending numbers built on such different assumptions would mislead, so they are laid side by side instead.
| Source | Method | XDC view |
|---|---|---|
| CoinCodex | Algorithmic | 2026 avg ~$0.038 (range ~$0.030–$0.042); near-term trading band into 2027 |
| Changelly | Algorithmic | 2026 avg ~$0.053, rising to ~$0.234 avg by 2030 |
| Cryptonews | Editorial / model blend | 2026 avg ~$0.032; 2030 avg ~$0.080 (range $0.05–$0.12) |
| 99Bitcoins | Editorial / model blend | 2026 avg ~$0.13; 2030 avg ~$0.57 (bullish outlier) |
The gap between Cryptonews near $0.08 and 99Bitcoins near $0.57 for the same 2030 line tells you how much rests on one variable: whether institutional RWA tokenization actually routes volume through XDC or merely name-checks it. PrimeXBT’s own path sits in the sober half of that range, closer to the algorithmic models than to the promotional highs. Anyone hunting a single agreed number will not find one here.
Track record of this forecast
This is the first XDC price outlook PrimeXBT has published. From the next monthly review onward, this section will hold the previous forecast up against XDC’s actual price on the update date and account for any gap instead of quietly moving on from it.
XDC Network technical analysis
As of late August 2026, XDC sits between its two most-watched moving averages. It trades above its 50-day simple moving average near $0.027, a sign it has recovered from its summer lows, but hovers just under its 200-day average around $0.031, which keeps the longer trend flat rather than up. The RSI has held in the high-50s to low-60s, neutral to mildly firm, with no overbought extreme yet. The Fear & Greed Index reads around 73, in “Greed” territory, a reminder that sentiment is running warmer than price action alone would justify.
The support and resistance levels in play now: support at $0.027, then $0.024, with a deeper demand zone near $0.020; resistance at $0.033, then $0.038–$0.040, with a broader supply band around $0.050. Holding above the 200-day line at $0.031 would be the first real evidence that the flat phase is turning up. For a primer on reading these signals, see PrimeXBT’s guide to crypto technical analysis.
Correlation with other assets
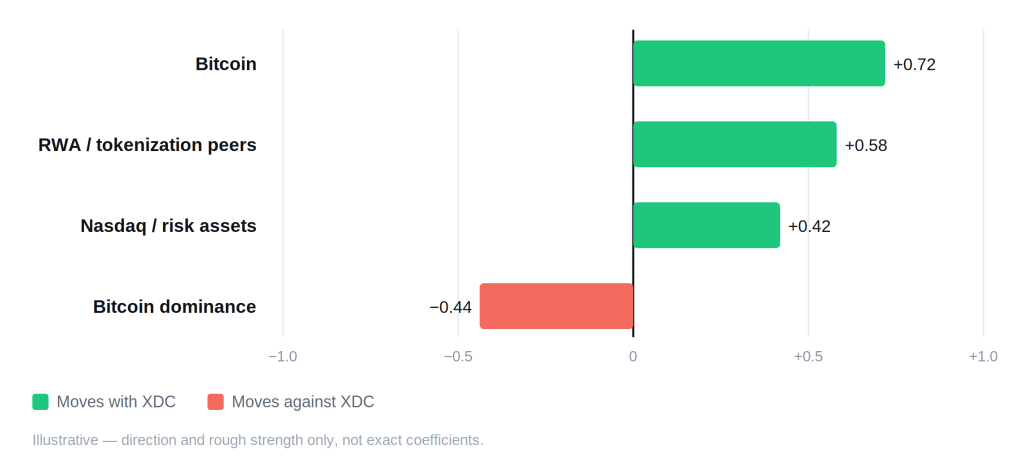
XDC still takes its lead from Bitcoin, the way most mid-cap alts do, and it rises and falls with the broader appetite for risk that also drives the Nasdaq. What sets it apart is a second pull: XDC tends to trade with the real-world-asset and tokenization cohort, moving alongside tokens like ONDO when that narrative catches a bid, which can decouple it from the rest of the alt market on RWA-specific news. Against Bitcoin dominance the relationship runs the other way, as it does for most altcoins: when capital crowds back into Bitcoin, XDC and its peers tend to bleed. None of these ties are fixed, and the RWA link in particular tightens and loosens as that theme moves in and out of focus.
Fundamental factors
XDC Network aims at a specific job: settling trade-finance instruments and tokenized real-world assets on-chain. The network clears transactions in under two seconds with fees typically below a hundredth of a cent, which is the kind of cost and speed profile institutional back-offices need before they will move paper documents onto a blockchain. XDPoS, its delegated-proof-of-stake consensus, secures the chain through masternodes that each require a large XDC stake, so a meaningful share of supply is locked rather than circulating.
The token’s case rests on adoption, not scarcity. Circulating supply sits near 20 billion XDC out of a total above 38 billion, so unlike Bitcoin there is no hard cap doing the heavy lifting. What moves the story is real usage: tokenization initiatives such as VERT Capital’s Brazilian debt program, money-market-fund tokenization through Archax, and trade-document work with R3 Corda, alongside institutional partners including SBI in Japan. ISO 20022 alignment and EVM compatibility lower the friction for banks and developers respectively, but the honest read is that most of this remains early — pipelines and pilots that have yet to translate into sustained on-chain volume. The market capitalization reflects that gap: a network with serious enterprise ambitions still valued as a speculative mid-cap.
Upcoming catalysts
Only confirmed, dated events are listed. With XDC now tracking risk assets, Federal Reserve policy is the clearest near-term driver, while the network’s own catalysts tend to arrive without fixed calendar dates.
| Date | Event | Potential impact |
|---|---|---|
| September 15–16, 2026 | FOMC meeting (with economic projections) | Bull if the Fed signals cuts; bear if it holds rates higher for longer |
| October 27–28, 2026 | FOMC meeting | Rate path steers risk appetite across the alt market |
| December 8–9, 2026 | FOMC meeting (with economic projections) | Year-end policy signal that frames 2027 positioning |
| 2026 (date not confirmed) | Further RWA tokenization rollouts on XDC (e.g. VERT Capital, Archax) | Bull if pilots convert to sustained on-chain volume; no fixed date announced |
FOMC dates follow the Federal Reserve’s published 2026 schedule. The tokenization rollouts are listed without a date because none has been confirmed — an invented date would be a guess, not information.
Bull case vs bear case
Bull case:
- Institutional RWA and trade-finance tokenization routes real volume through XDC, turning the narrative into on-chain activity.
- The Fed eases, risk appetite returns, and capital rotates back toward mid-cap alts.
- ISO 20022 alignment and enterprise partnerships convert into recurring, fee-generating usage.
- Masternode staking keeps a large share of supply locked, thinning the float available to sell.
Bear case:
- RWA adoption stays a pitch deck rather than throughput, and the enterprise premium never arrives.
- Rates stay higher for longer, keeping speculative alts under pressure.
- XDC keeps trading below its 200-day average, with “Greed” sentiment unwinding into disappointment.
- A drift back toward the low $0.020s if the $0.027 floor cracks under sustained selling.
Invalidation levels. The bull case weakens if XDC closes below $0.027, the nearest support and its 50-day average. The bear case is invalidated on a sustained break above $0.040, and more decisively on a reclaim of the broader $0.050 supply band; the first sign of a turn would simply be XDC holding above its 200-day line near $0.031. The nearer downside trigger, $0.027, sits about 10% below spot, while $0.040 is roughly a third above it.
Historical performance
XDC’s chart is a study in one huge cycle and a long aftermath. It ran to a record near $0.19 in August 2021, then gave back the overwhelming majority of that move, and in late August 2026 it changes hands around $0.030, still some 85% under the peak. A shorter-lived rally into early 2025 lifted it back above $0.15 before fading again. The pattern is boom, deep drawdown, and slow base-building, and nothing about it guarantees the next leg repeats the last.
Is XDC a good investment in 2026?
XDC is a bet on one specific thesis: that banks and asset managers will settle trade-finance instruments and tokenized assets on a purpose-built chain, and that XDC captures the value when they do. PrimeXBT’s outlook sees the token roughly flat into year-end, averaging near $0.032, with the real re-rating, if it comes, arriving later in the cycle. The bullish read is a network with genuine enterprise partnerships trading at a speculative valuation; the bearish read is that the same has been true for years without the volume to match. Sentiment sits in “Greed” while price grinds sideways, which is worth noting either way. Whether that reads as mispriced opportunity or as patience running thin is the reader’s judgment to make.
How to trade XDC Network on PrimeXBT
PrimeXBT lets you take a position in either direction on a wide range of markets. CFDs can be traded long or short, so a view can be expressed whether you expect XDC’s tokenization thesis to pay off or to stall — short selling covers the downside case. Leverage magnifies gains and losses alike, and on a token as volatile as a mid-cap alt, position sizing and a stop-loss do more work than any forecast. Trade on your own analysis and risk tolerance, and never risk more than you can afford to lose.
Trading involves risk.
How we build this forecast
PrimeXBT’s analysts assemble this outlook rather than lift it from one price feed. The starting point is where XDC trades today, read against its 50- and 200-day moving averages and the support and resistance levels that matter now. From there the fundamentals come in — masternode staking, ISO 20022 alignment, the pace of real RWA and trade-finance adoption — and all of it is weighed against the macro backdrop, chiefly the path of U.S. interest rates. The yearly ranges fuse that technical read with the fundamental and macro picture; the long-range figures lean on trajectory over precision.
None of this is a promise. Crypto moves hard, the inputs shift, and a single macro or adoption surprise can push XDC faster than any model expects. Treat every figure here as a considered estimate rather than a guarantee — the outlook is revisited and updated monthly as the data changes.
Author



 Risk Disclaimer
The content provided here is for informational purposes only. It is not intended as personal investment advice and does not constitute a solicitation or invitation to engage in any financial transactions, investments, or related activities. Past performance is not a reliable indicator of future results.
The financial products offered by the Company are complex and come with a high risk of losing money rapidly due to leverage. These products may not be suitable for all investors. Before engaging, you should consider whether you understand how these leveraged products work and whether you can afford the high risk of losing your money.
The Company does not accept clients from the Restricted Jurisdictions as indicated in our website/ T&C. Some services or products may not be available in your jurisdiction.
The applicable legal entity and its respective products and services depend on the client’s country of residence and the entity with which the client has established a contractual relationship during registration.








