
 14 min read
 Zilliqa (ZIL) trades near $0.0027 in late August 2026, days after printing a fresh all-time low. ZIL is the native token of Zilliqa, a Layer-1 blockchain that was among the first to run sharding on a live mainnet and later added proof-of-stake and Ethereum Virtual Machine support in its 2.0 upgrade. The token pays network fees, secures the chain through staking, and settles activity across the apps built on it. This page lays out PrimeXBT’s price outlook for ZIL through 2030 and out to 2050, the levels traders are watching now, and the catalysts that could move it. Figures are framed as ranges, not decimal-point promises, and where the picture is genuinely murky the text says so.
Zilliqa outlook at a glance
- 2026 base case: roughly $0.0026–$0.0031, a token grinding along its floor rather than starting a new trend.
- Main bullish catalyst: a broad crypto cycle upswing into 2028 pulling capital back down the risk curve into older small-cap Layer-1s, with Zilliqa 2.0’s EVM compatibility drawing developers back to the chain.
- Biggest downside risk: capital staying concentrated in majors while a sustained break below the $0.00219 record low turns the current base into a lower one.
- Long-term view: our model sees a modest cyclical recovery, but any figure past 2030 reads as a direction of travel, not a target you can trade against.
Live Zilliqa price chart
The chart below tracks ZIL/USD in real time; the levels that matter right now are broken out in the technical section further down.
Trading involves risk.
Zilliqa price prediction 2026–2030 (yearly forecast)
The table below sets our expected range for each year. Long-horizon third-party targets rest on wildly different assumptions and are kept out of this table, in the analyst comparison section, rather than blended into a single false average.
| Year | Minimum | Average | Maximum |
|---|---|---|---|
| 2026 | $0.00258 | $0.00288 | $0.00328 |
| 2027 | $0.00301 | $0.00535 | $0.00863 |
| 2028 | $0.00693 | $0.00945 | $0.01203 |
| 2029 | $0.00531 | $0.00763 | $0.01043 |
| 2030 | $0.00437 | $0.00626 | $0.00820 |
Zilliqa price prediction 2026
Our 2026 outlook for Zilliqa holds ZIL close to its late-August level near $0.0027, a full-year range of about $0.00258–$0.00328 averaging near $0.0028. That is a coin defending a floor, not one breaking out. ZIL set a record low of $0.00219 on 18 August 2026 and bounced more than 20% inside a week, so the near-term shape is a low base with sharp, shallow rallies rather than a sustained climb.
For the remaining months of 2026, our month-by-month view keeps ZIL in a narrow band that drifts sideways to slightly higher into December:
| Month (2026) | Minimum | Average | Maximum |
|---|---|---|---|
| August | $0.00258 | $0.00280 | $0.00302 |
| September | $0.00259 | $0.00283 | $0.00306 |
| October | $0.00260 | $0.00285 | $0.00310 |
| November | $0.00266 | $0.00293 | $0.00319 |
| December | $0.00272 | $0.00300 | $0.00328 |
Zilliqa price prediction 2027
2027 is where our model turns the corner: the path climbs off the base toward roughly $0.0065 by year-end, a full-year range of about $0.00301–$0.00863 averaging near $0.0052. The step up assumes the broader market thaws and some capital rotates back toward older Layer-1 names, not a Zilliqa-specific breakthrough.
| Month (2027) | Minimum | Average | Maximum |
|---|---|---|---|
| January | $0.00301 | $0.00334 | $0.00366 |
| February | $0.00331 | $0.00368 | $0.00405 |
| March | $0.00360 | $0.00402 | $0.00443 |
| April | $0.00388 | $0.00435 | $0.00482 |
| May | $0.00417 | $0.00469 | $0.00521 |
| June | $0.00445 | $0.00503 | $0.00561 |
| July | $0.00478 | $0.00542 | $0.00606 |
| August | $0.00514 | $0.00585 | $0.00657 |
| September | $0.00550 | $0.00629 | $0.00708 |
| October | $0.00586 | $0.00673 | $0.00759 |
| November | $0.00622 | $0.00716 | $0.00811 |
| December | $0.00657 | $0.00760 | $0.00863 |
Zilliqa price prediction 2028
2028 carries the cycle high in our model. The path peaks mid-year near $0.010 before easing, for a full-year range of about $0.00693–$0.01203 and an average near $0.0095. Reaching even a cent would mean reclaiming roughly $210 million in market value, close to four times where ZIL sits today, so the peak is framed as a cyclical recovery, not a return to the 2021 mania.
| Month (2028) | Minimum | Average | Maximum |
|---|---|---|---|
| January | $0.00693 | $0.00805 | $0.00916 |
| February | $0.00728 | $0.00849 | $0.00970 |
| March | $0.00764 | $0.00894 | $0.01024 |
| April | $0.00798 | $0.00938 | $0.01079 |
| May | $0.00833 | $0.00983 | $0.01133 |
| June | $0.00867 | $0.01028 | $0.01188 |
| July | $0.00872 | $0.01037 | $0.01203 |
| August | $0.00847 | $0.01012 | $0.01177 |
| September | $0.00822 | $0.00986 | $0.01151 |
| October | $0.00798 | $0.00961 | $0.01124 |
| November | $0.00773 | $0.00935 | $0.01098 |
| December | $0.00749 | $0.00910 | $0.01071 |
Zilliqa price prediction 2029
2029 is the give-back year. After the 2028 top, our path eases through the year to a range of about $0.00531–$0.01043 with an average near $0.0074, the familiar cool-down that tends to follow a crypto cycle peak.
| Month (2029) | Minimum | Average | Maximum |
|---|---|---|---|
| January | $0.00724 | $0.00884 | $0.01043 |
| February | $0.00700 | $0.00858 | $0.01015 |
| March | $0.00676 | $0.00832 | $0.00987 |
| April | $0.00652 | $0.00805 | $0.00959 |
| May | $0.00628 | $0.00779 | $0.00931 |
| June | $0.00604 | $0.00753 | $0.00902 |
| July | $0.00587 | $0.00735 | $0.00882 |
| August | $0.00576 | $0.00724 | $0.00872 |
| September | $0.00564 | $0.00713 | $0.00861 |
| October | $0.00553 | $0.00702 | $0.00850 |
| November | $0.00542 | $0.00691 | $0.00839 |
| December | $0.00531 | $0.00680 | $0.00829 |
Zilliqa price prediction 2030
Our 2030 view for Zilliqa spans roughly $0.00437–$0.00820, averaging near $0.0062. Four years out the model leans on trajectory rather than precision, so read the monthly path below as the slope of a recovery that has already cooled, not a set of dates you can mark a calendar by.
| Month (2030) | Minimum | Average | Maximum |
|---|---|---|---|
| January | $0.00522 | $0.00671 | $0.00820 |
| February | $0.00512 | $0.00662 | $0.00811 |
| March | $0.00503 | $0.00652 | $0.00802 |
| April | $0.00494 | $0.00643 | $0.00792 |
| May | $0.00484 | $0.00634 | $0.00783 |
| June | $0.00475 | $0.00625 | $0.00774 |
| July | $0.00467 | $0.00617 | $0.00767 |
| August | $0.00461 | $0.00612 | $0.00762 |
| September | $0.00455 | $0.00606 | $0.00758 |
| October | $0.00449 | $0.00601 | $0.00753 |
| November | $0.00443 | $0.00595 | $0.00748 |
| December | $0.00437 | $0.00590 | $0.00743 |
Zilliqa long-term price prediction: 2035, 2040–2050
Put a number on ZIL in 2040 and you are really forecasting the entire crypto market, three cycles of technology, and a macro backdrop nobody can see from here. The honest read on the decade ahead is a widening cone, not a line. With that stated plainly, our long-range path drifts higher at a walking pace, never a sprint:
| Year | Minimum | Average | Maximum |
|---|---|---|---|
| 2035 | $0.00665 | $0.00950 | $0.01235 |
| 2040 | $0.00928 | $0.01450 | $0.01972 |
| 2050 | $0.01232 | $0.02200 | $0.03168 |
What analysts and models say (compared)
Few tokens split forecasters as cleanly as Zilliqa. Momentum-driven algorithms extrapolate the multi-year downtrend and see ZIL drifting lower still; editorial and recovery-model forecasters assume the next cycle lifts it many times over. The gap runs from a tenth of a cent to twenty cents on the same 2030 line, so averaging them would invent a consensus that does not exist.
| Source | Method | Zilliqa view |
|---|---|---|
| CoinCodex | Algorithmic (momentum) | ~$0.0027 for 2026, drifting to ~$0.0009 by 2030 |
| Changelly | Algorithmic (momentum) | Avg ~$0.0027 in 2026, declining to ~$0.0009 by 2030 |
| LiteFinance | Blended / editorial | Avg ~$0.0146 in 2026, ~$0.079 by 2030 |
| DigitalCoinPrice | Algorithmic | Avg ~$0.053 in 2026, ~$0.10 by 2030 |
| Coinpedia | Editorial | Up to ~$0.045 in 2026, avg ~$0.165 by 2030 |
The disagreement is the finding. Two of the most-followed algorithmic aggregators, CoinCodex and Changelly, land almost on top of each other with a slow bleed toward a tenth of a cent by 2030, because their models weight recent price action and recent price action has been down. The recovery camp, Coinpedia and DigitalCoinPrice, prices in a cycle rebound and lands roughly forty to a hundred and eighty times higher on the same year. PrimeXBT’s own path sits between them, closer to the conservative cluster: a real but restrained recovery that never approaches the 2021 highs. Anyone shopping for a single confident ZIL number will not find one in the market.
Track record of this forecast
This is the first published PrimeXBT price forecast for Zilliqa. From the next monthly review onward, this section will hold the previous forecast up against ZIL’s actual price on the update date and account for any miss instead of quietly deleting it.
Zilliqa technical analysis
ZIL sits below its longer-term trend and roughly on its shorter one. It trades under the 200-day simple moving average near $0.0036, the signature of a market still in a downtrend, while hugging its 50-day average around $0.0026 after the late-August bounce off record lows. The RSI reads in the mid-range through late August, neither stretched nor washed out, and the broader Fear & Greed Index sits in Greed near 70, a whole-market reading driven by the majors rather than by anything happening on Zilliqa.
The support and resistance that matter now: support at roughly $0.0025, then the $0.00219 record low set on 18 August 2026, which is the line in the sand for the whole outlook. Resistance stacks at about $0.0029, then the 200-day average near $0.0036, then a psychological shelf around $0.0040. Reclaiming the 200-day would be the first real evidence the multi-year downtrend has broken rather than paused. For a primer on reading these signals, see PrimeXBT’s guide to crypto technical analysis.
Correlation with other assets
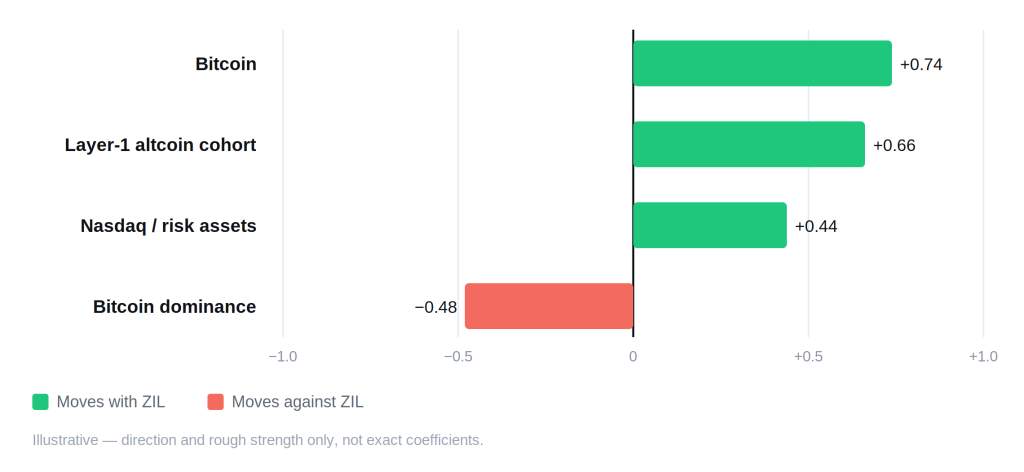
Zilliqa trades as a high-beta echo of the broader market. Its tightest link is to Bitcoin, and almost as tight to the wider Layer-1 altcoin cohort, so ZIL tends to fall harder in selloffs and jump harder in relief rallies than the majors it follows. It has a looser positive pull toward risk assets like the Nasdaq, which is why U.S. rate expectations reach even a small-cap token like this one. The most telling relationship is the inverse one: when Bitcoin dominance rises and capital crowds into Bitcoin, older alts like ZIL are usually the last to get funded and the first to be sold, which is exactly the setup behind a token making new lows while the market-wide sentiment gauge reads greed. These pulls are directional and drift over time rather than holding to any fixed number.
Fundamental factors
Zilliqa’s pitch has always been throughput through sharding: split the network into groups that process transactions in parallel, and it scales as it grows. It launched its mainnet in 2019 as one of the first public chains to ship sharding, paired with Scilla, a smart-contract language written to make certain classes of exploit hard to express in the first place. That safety-first design was a genuine differentiator when few Layer-1s could handle load.
The problem is that the field caught up and then overtook it. Zilliqa shipped its 2.0 upgrade on 23 June 2025, moving from proof-of-work to proof-of-stake and adding EVM compatibility so developers can deploy Ethereum-native apps with little rework. It is a real modernization. It also has not reversed the token’s slide: ZIL printed a record low more than a year after 2.0 went live, which tells you the upgrade removed a technical barrier without yet solving the harder problem of pulling users and liquidity back to a chain the market had moved past. Supply is capped near 21 billion ZIL with roughly 19–20 billion already circulating, so there is no large emission overhang left to absorb, but there is also no scarcity story to lean on. For context on how a token’s market value scales with its supply, see PrimeXBT’s explainer on cryptocurrency market capitalization.
Upcoming catalysts
Only confirmed, dated events are listed. With Zilliqa 2.0 already shipped and no further mainnet milestone carrying a fixed date, the clearest near-term drivers for ZIL are macro, because a high-beta small-cap moves with market-wide risk appetite.
| Date | Event | Potential impact |
|---|---|---|
| September 15–16, 2026 | FOMC meeting (with economic projections) | Bull if the Fed signals cuts; bear if it holds rates higher for longer |
| October 27–28, 2026 | FOMC meeting | Rate path steers risk appetite across the alt market |
| December 8–9, 2026 | FOMC meeting (with economic projections) | Year-end policy signal that frames 2027 positioning |
FOMC dates follow the Federal Reserve’s published 2026 schedule. No Zilliqa-specific network event is listed because none with a confirmed date is on the calendar; an estimated one would be a guess, not information.
Bull case vs bear case
Bull case:
- The Fed eases and capital rotates back down the risk curve, where beaten-down Layer-1s like ZIL tend to move most.
- Zilliqa 2.0’s EVM support pulls developers and apps back onto the chain, turning a technical upgrade into real usage.
- A cycle upswing into 2028 lifts the whole alt cohort ZIL trades with.
- With emission nearly complete, any renewed demand meets a supply that is no longer growing.
Bear case:
- Capital stays concentrated in Bitcoin and a handful of large-cap alts, leaving older names unfunded.
- The 2.0 upgrade keeps failing to convert into users, and ZIL stays a chain the market has moved past.
- Rates stay higher for longer, keeping speculative small-caps under pressure.
- Weak momentum drags the token back to and through its record low.
Invalidation levels. The bull case loses its footing if ZIL closes below the $0.00219 record low on sustained volume, since a fresh floor would reset every range above it. The bear case is invalidated on a decisive reclaim of the 200-day average near $0.0036, roughly a third above the late-August price and the level that would mark the multi-year downtrend as broken rather than merely paused. Both figures come straight from the technical section above.
Historical performance
Zilliqa’s arc is a single mania followed by a long tide out. From a 2017 ICO and a 2019 mainnet, ZIL rode the 2021 cycle to a record $0.2554 in May 2021, then gave almost all of it back: by August 2026 it traded roughly 99% below that peak and set a new record low. The token has had sharp counter-trend rallies along the way, but the multi-year direction has been down, and no cycle is required to hand back what the last one took. The recovery our model sketches is a fraction of that former high, by design.
Is Zilliqa a good investment in 2026?
Zilliqa is a deep-value, high-risk bet on an early sharding pioneer clawing back relevance it has largely lost. Our outlook sees ZIL roughly flat into year-end, near a $0.0028 average, with the real question being whether Zilliqa 2.0 eventually converts into usage or the chain keeps fading while newer Layer-1s take the flows. The bull case needs both a friendlier market and a genuine developer return; the bear case needs only the status quo. Sizing matters more here than conviction, and a token at record lows can stay there. Whether that reads as a bargain or a value trap is the reader’s call to make.
How to trade Zilliqa on PrimeXBT
On PrimeXBT you can take a position on the market in either direction. CFDs let you go long or short without holding the underlying token, which suits an asset that can trend down for years and rally hard in between. Leverage cuts both ways, magnifying losses as readily as gains, so position sizing and a stop-loss do real work on a small-cap this volatile. Trade on your own analysis and risk tolerance, and never risk more than you can afford to lose.
Trading involves risk.
How we build this forecast
PrimeXBT’s analysts assemble this outlook rather than lifting it from one price feed. We start from where ZIL trades today, place it against its 50- and 200-day moving averages and the support and resistance that frame it, weigh the fundamentals — sharding, the Zilliqa 2.0 move to proof-of-stake and EVM support, near-complete emission, and the competition from newer chains — and set the whole picture against the macro backdrop, chiefly U.S. rate expectations and where capital sits on the risk curve. The yearly ranges fuse that technical read with the fundamental and macro view; the long-range figures lean on trajectory over precision.
None of this is a guarantee. Crypto is volatile, a small-cap like ZIL more so, and one market-wide swing can move it faster than any model expects. Read every figure here as a considered estimate rather than a promise, and note that we revisit and update this outlook monthly as the data shifts.
How much will Zilliqa be worth in 2026?
Our outlook is roughly $0.0026–$0.0031 for 2026, averaging near $0.0028 — essentially flat, with the token defending its recent lows rather than breaking out.
How much will Zilliqa be worth in 2030?
Our long-range view is roughly $0.0050–$0.0075, averaging near $0.0062. On a four-year horizon treat that as the slope of a recovery rather than a firm target; the plausible range across the market runs from under a tenth of a cent to well over ten cents.
What will Zilliqa be worth in five years?
See the 2030 and long-term figures above. This far out, any single number is a direction of travel, not a price you can trade against, and small changes in the broader cycle swing it by multiples.
Can Zilliqa reach $1?
Not on our numbers, and the math explains why. At a supply near 21 billion ZIL, a $1 price would put Zilliqa's market value around $21 billion — more than seven times its 2021 peak and roughly 370 times its current market capitalization. Even $0.10 would require about $2.1 billion, some forty times today's value and well above the top of our modeled range near $0.012. A move to a full dollar would take a cycle unlike anything in the token's history.
Is Zilliqa 2.0 live, and does it change the outlook?
Yes. Zilliqa 2.0 went live on 23 June 2025, moving the network to proof-of-stake and adding EVM compatibility so Ethereum apps can deploy with little rework. It removed a real technical barrier, but ZIL set a new record low more than a year later, so the upgrade has not yet turned into the users and liquidity that would change the price picture.
Author



 Risk Disclaimer
The content provided here is for informational purposes only. It is not intended as personal investment advice and does not constitute a solicitation or invitation to engage in any financial transactions, investments, or related activities. Past performance is not a reliable indicator of future results.
The financial products offered by the Company are complex and come with a high risk of losing money rapidly due to leverage. These products may not be suitable for all investors. Before engaging, you should consider whether you understand how these leveraged products work and whether you can afford the high risk of losing your money.
The Company does not accept clients from the Restricted Jurisdictions as indicated in our website/ T&C. Some services or products may not be available in your jurisdiction.
The applicable legal entity and its respective products and services depend on the client’s country of residence and the entity with which the client has established a contractual relationship during registration.








