
 14 min read
 BNB, once branded Binance Coin, is the native token of the Binance ecosystem — it buys trading-fee discounts on the Binance exchange and pays gas on BNB Chain, the smart-contract network Binance builds around. In early August 2026 BNB trades near $600, roughly 56% below the record $1,370 it set in October 2025. This page lays out PrimeXBT’s forecast for BNB through 2030 and out to 2050, the levels traders are watching now, and the events that could move the price either way. Where the data supports a number, we give one; where a decade-out figure would only pretend to precision, we say that instead.
BNB outlook at a glance
- Current price: $792.40 per BNB.
- 2026 base case: $558.00–$819.63 — a recovery year, still trading below the 2025 peak.
- Main bullish catalyst: steady quarterly burns thinning supply, spot BNB ETF inflows, and a Federal Reserve easing cycle pulling capital back to risk.
- Biggest downside risk: fresh regulatory pressure on Binance or a broad risk-off turn, with a close below the $544 support opening the next leg down.
- Long-term view: the base case is a gradual climb led by the burn and ecosystem growth, but anything past 2030 reads as a direction, not a dated target.
Live BNB price chart
Today (5 October 2026) BNB (BNB/USD) is trading at $792.40 per BNB, with a market cap of $105,281,812,198 USD. The 24-hour trading volume amounts to $1,580,625,819 USD. BNB price has changed by 0.75% in the last 24 hours. BNB’s circulating supply is 133,159,035 BNB.
Trading involves risk.
BNB price prediction 2026–2030 (yearly forecast)
The table below sets PrimeXBT’s expected range for each year. The far-above institutional target for BNB rests on different assumptions, so it is kept in the analyst section rather than folded into these numbers.
| Year | Minimum | Average | Maximum |
|---|---|---|---|
| 2026 | $558.00 | $680.00 | $819.63 |
| 2027 | $739.78 | $1,018.53 | $1,302.54 |
| 2028 | $1,101.73 | $1,474.27 | $1,851.94 |
| 2029 | $1,420.25 | $1,720.42 | $2,025.99 |
| 2030 | $1,279.20 | $1,617.48 | $1,932.63 |
BNB price prediction 2026
Our 2026 outlook keeps BNB in recovery rather than a fresh bull run, with the forward months averaging near $685 inside a full-year band of $558.00–$819.63. That leaves the token well under its October 2025 record and reflects a market rebuilding from the late-2025 drawdown, not launching a new cycle.
For the rest of 2026, the month-by-month path holds BNB in a slowly rising band as it works back toward the $700 area:
| Month (2026) | Minimum | Average | Maximum |
|---|---|---|---|
| August | $558.00 | $600.00 | $642.00 |
| September | $593.85 | $640.00 | $686.15 |
| October | $629.52 | $680.00 | $730.48 |
| November | $665.03 | $720.00 | $774.97 |
| December | $700.37 | $760.00 | $819.63 |
BNB price prediction 2027
2027 is the step-up year: the path climbs off the 2026 base toward an average near $1,020, a full-year band of $739.78–$1,302.54. The move leans on returning exchange volume and on-chain activity rather than a single headline.
| Month (2027) | Minimum | Average | Maximum |
|---|---|---|---|
| January | $739.78 | $804.62 | $869.45 |
| February | $779.01 | $849.23 | $919.46 |
| March | $818.04 | $893.85 | $969.65 |
| April | $856.89 | $938.46 | $1,020.04 |
| May | $895.55 | $983.08 | $1,070.61 |
| June | $934.01 | $1,027.69 | $1,121.37 |
| July | $962.78 | $1,061.82 | $1,160.85 |
| August | $981.92 | $1,085.45 | $1,188.99 |
| September | $1,000.95 | $1,109.09 | $1,217.23 |
| October | $1,019.89 | $1,132.73 | $1,245.56 |
| November | $1,038.73 | $1,156.36 | $1,274.00 |
| December | $1,057.46 | $1,180.00 | $1,302.54 |
BNB price prediction 2028
2028 carries the rally further, averaging near $1,500 across a band of $1,101.73–$1,851.94. This is the year the outlook reclaims the four-figure territory BNB last held in 2025, though the shape depends heavily on the broader crypto cycle around the next Bitcoin halving.
| Month (2028) | Minimum | Average | Maximum |
|---|---|---|---|
| January | $1,101.73 | $1,232.31 | $1,362.88 |
| February | $1,145.78 | $1,284.62 | $1,423.45 |
| March | $1,189.60 | $1,336.92 | $1,484.24 |
| April | $1,233.21 | $1,389.23 | $1,545.25 |
| May | $1,276.59 | $1,441.54 | $1,606.48 |
| June | $1,319.76 | $1,493.85 | $1,667.94 |
| July | $1,349.26 | $1,530.91 | $1,712.56 |
| August | $1,365.21 | $1,552.73 | $1,740.25 |
| September | $1,381.06 | $1,574.55 | $1,768.03 |
| October | $1,396.82 | $1,596.36 | $1,795.91 |
| November | $1,412.49 | $1,618.18 | $1,823.88 |
| December | $1,428.06 | $1,640.00 | $1,851.94 |
BNB price prediction 2029
2029 holds the cycle high in our outlook, averaging near $1,720 within a band of $1,420.25–$2,025.99. The peak lands here rather than earlier because speculative tops have historically trailed the halving by 12 to 18 months, and this window fits that rhythm.
| Month (2029) | Minimum | Average | Maximum |
|---|---|---|---|
| January | $1,443.30 | $1,661.54 | $1,879.78 |
| February | $1,458.45 | $1,683.08 | $1,907.70 |
| March | $1,473.51 | $1,704.62 | $1,935.72 |
| April | $1,488.48 | $1,726.15 | $1,963.83 |
| May | $1,503.35 | $1,747.69 | $1,992.03 |
| June | $1,518.14 | $1,769.23 | $2,020.33 |
| July | $1,515.83 | $1,770.91 | $2,025.99 |
| August | $1,496.56 | $1,752.73 | $2,008.90 |
| September | $1,477.37 | $1,734.55 | $1,991.73 |
| October | $1,458.25 | $1,716.36 | $1,974.48 |
| November | $1,439.21 | $1,698.18 | $1,957.15 |
| December | $1,420.25 | $1,680.00 | $1,939.75 |
BNB price prediction 2030
Our 2030 view cools gently off the 2029 top to an average near $1,620, spanning $1,279.20–$1,932.63. Five years out the outlook leans on trajectory over precision, so read the monthly path below as a shape rather than a set of dated targets.
| Month (2030) | Minimum | Average | Maximum |
|---|---|---|---|
| January | $1,408.91 | $1,670.77 | $1,932.63 |
| February | $1,397.61 | $1,661.54 | $1,925.47 |
| March | $1,386.35 | $1,652.31 | $1,918.27 |
| April | $1,375.13 | $1,643.08 | $1,911.02 |
| May | $1,363.95 | $1,633.85 | $1,903.74 |
| June | $1,352.80 | $1,624.62 | $1,896.43 |
| July | $1,341.00 | $1,614.55 | $1,888.09 |
| August | $1,328.55 | $1,603.64 | $1,878.72 |
| September | $1,316.14 | $1,592.73 | $1,869.31 |
| October | $1,303.78 | $1,581.82 | $1,859.85 |
| November | $1,291.47 | $1,570.91 | $1,850.35 |
| December | $1,279.20 | $1,560.00 | $1,840.80 |
BNB long-term price prediction: 2035, 2040–2050
A ten-year price target is closer to a scenario than a forecast. No model can account for the halving cycles, technology shifts, and policy regimes still ahead, so treat everything below as a trajectory whose error bars widen with every year out. On that basis our long-range path drifts higher in steps — an average near $2,250 in 2035, near $2,900 in 2040, and near $4,200 in 2050 — without any sudden vertical leg:
| Year | Minimum | Average | Maximum |
|---|---|---|---|
| 2035 | $1,755.00 | $2,250.00 | $2,745.00 |
| 2040 | $2,088.00 | $2,900.00 | $3,712.00 |
| 2050 | $2,688.00 | $4,200.00 | $5,712.00 |
What analysts and models say (compared)
BNB forecasts sit far apart, and the gap is instructive. Algorithmic aggregators cluster near $700 for 2026, while at least one bank has published a multi-year target several times higher. Blending numbers built on incompatible methods would mislead, so they are laid out side by side.
| Source | Method | BNB view |
|---|---|---|
| CoinCodex | Algorithmic | 2026 avg ~$713 (range $602–$939) |
| Changelly | Algorithmic | 2026 avg ~$704 (range $601–$939); 2030 avg ~$1,749 |
| Standard Chartered (Geoff Kendrick) | Institutional | ~$2,775 by end-2028 (published May 2025) |
The spread is the point. Standard Chartered’s Geoff Kendrick argued in May 2025 that BNB could reach about $2,775 by the end of 2028 — a fourfold move from the roughly $600 it traded at then — citing the token’s burn mechanism and BNB Chain usage. The algorithmic models, working purely from price history, see nothing like that in 2026 and only approach it in their outer 2029–2030 ranges. Anyone hunting for a single agreed number will not find one here.
Track record of this forecast
This is the first published PrimeXBT price forecast for BNB. From the next monthly review, this section will hold the prior forecast against BNB’s actual price on the update date, misses included, with a plain explanation of what moved the market.
BNB technical analysis
BNB sits between its two most-watched moving averages at the start of August 2026. It trades above the 50-day EMA near $584, which shows it has clawed back from the late-2025 lows, but below the 200-day EMA near $649, so the longer trend has not yet turned up. The RSI has held in neutral-to-mildly-positive territory around the low 60s, with no overbought extreme, and the crypto Fear & Greed Index reads 52 (Neutral), where it has camped for weeks.
The support and resistance levels that matter now: support at $586, then a horizontal floor near $544, with a deeper demand zone around $510; resistance at $617, then $641, with the 200-day EMA near $649 capping the range. Reclaiming that 200-day line is the cleanest signal that the recovery has become a trend rather than a bounce. For a primer on reading these signals, see PrimeXBT’s guide to crypto technical analysis.
Correlation with other assets
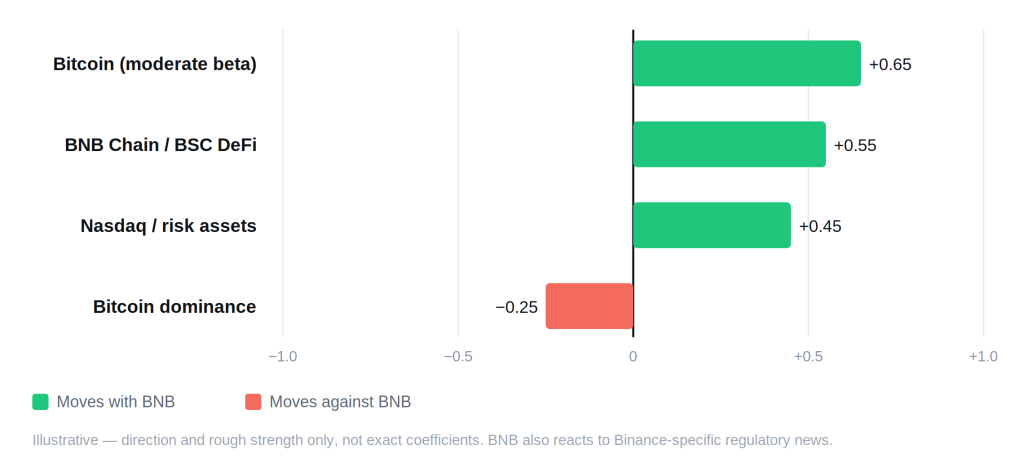
BNB moves with Bitcoin, but with a lighter touch than most altcoins. As one of the largest tokens by market value, it tends to swing less violently than small-cap names and has often held ground better on down days, so its beta to Bitcoin is moderate rather than extreme. Its own drivers pull hardest: exchange volume on Binance and activity across BNB Chain, including DeFi on the BNB Smart Chain, feed directly into demand for the token. BNB also tracks the large-cap crypto cohort and, since institutions arrived, the Nasdaq — which is why Federal Reserve policy now shows up in its price. The relationship with Bitcoin dominance is softer than for smaller alts, because BNB is large enough to absorb some of the rotations that sink the rest of the field. The wildcard is idiosyncratic: headlines about Binance’s regulatory standing can move BNB on their own, independent of the broader market. Read these as tendencies rather than fixed numbers; each one loosens or tightens as the cycle turns.
Fundamental factors
BNB launched in July 2017 as an ERC-20 token on Ethereum, sold in an ICO to give Binance users a discount on trading fees. It has since become the native asset of BNB Chain — the BNB Smart Chain, the opBNB layer-2, and the Greenfield storage network — where it pays gas, secures the chain, and powers Launchpad sales and DeFi across the ecosystem. That utility, not speculation alone, underpins demand for the token.
Supply is the fundamental worth watching. BNB runs a quarterly auto-burn that permanently destroys tokens until the total falls to 100 million. The 36th burn, on July 15, 2026, removed about 1.62 million BNB — roughly $932 million at the time — taking total supply to about 133.2 million. There is no inflationary staking reward diluting holders in the other direction; the mechanism only shrinks the float, which is the opposite of the issuance pressure that weighs on many networks. Validators still stake BNB to secure the chain, but the reward comes from fees, not new coin printing. PrimeXBT’s guide to staking covers how that model works.
The regulatory story sits behind everything. In November 2023 Binance and founder Changpeng Zhao pleaded guilty to U.S. charges in a resolution worth more than $4 billion, an overhang that dogged BNB for two years. Zhao received a presidential pardon in October 2025, and the acute legal risk has eased. Institutional access followed: VanEck launched the first U.S. spot BNB ETF, VBNB, on Nasdaq on May 28, 2026, giving regulated money a direct route into the token for the first time.
Upcoming catalysts
Only confirmed, dated events are listed. Macro policy is the clearest near-term driver, given how closely BNB now tracks risk assets.
| Date | Event | Potential impact |
|---|---|---|
| September 15–16, 2026 | FOMC meeting (with economic projections) | Bull if the Fed signals cuts; bear if it holds rates higher for longer |
| October 27–28, 2026 | FOMC meeting | Rate path drives risk appetite across crypto |
| December 8–9, 2026 | FOMC meeting (with economic projections) | Year-end policy signal for 2027 positioning |
| Q4 2026 (date not yet confirmed) | 37th quarterly BNB auto-burn | Further supply reduction toward the 100 million target; the exact date is announced after the quarter closes |
FOMC dates follow the Federal Reserve’s published 2026 schedule. The next burn is listed without a date because BNB Chain confirms each one only after the quarter ends — an estimated day would be a guess, not information.
Bull case vs bear case
Bull case:
- Each quarterly burn removes more supply, tightening the float as demand recovers.
- Spot BNB ETF inflows through VanEck’s VBNB add a steady institutional bid.
- The Fed shifts to rate cuts and capital rotates back into risk assets, BNB among them.
- BNB Chain activity and DeFi usage climb, lifting real demand for gas.
Bear case:
- New regulatory pressure on Binance revives the idiosyncratic risk that has hit BNB before.
- Rates stay higher for longer, keeping crypto capped and BNB below its 200-day EMA.
- Exchange volume and on-chain activity fade, undercutting the demand side of the burn story.
- Selling pressure builds and BNB loses the $544 floor, exposing the deeper $510 zone.
Invalidation levels. The bull case weakens if BNB closes below the $544 support, the level that has held the recovery together. The bear case is invalidated on a sustained reclaim of the 200-day EMA near $649 and a break above the $617 resistance — the point at which the longer downtrend would be broken rather than merely paused. Both levels come straight from the technical read above.
Historical performance
BNB’s history is a staircase of sharp cycles, not a smooth climb. It debuted in the 2017 ICO at a fraction of a dollar, rode the 2021 boom into the high hundreds, and then ran to a record $1,370 in October 2025 on surging BNB Chain activity. The fall since has been steep: by early August 2026 it trades about 56% below that peak and just under its own 200-day average. Each past cycle has drawn down hard before recovering, and no cycle is bound to copy the last.
Is BNB a good investment in 2026?
Whether BNB earns a place in a portfolio comes down to what an investor is buying it for. Our outlook sees a recovery year rather than a breakout — an average near $685 for 2026, well below the 2025 record. The underlying case is more concrete than the price: a shrinking supply from quarterly burns, real utility across BNB Chain, a regulatory cloud that has largely cleared, and a new spot ETF opening the door to institutions. Set against that, BNB carries a Binance-specific risk that most large caps do not. A trader can weigh those facts against the token’s market capitalization and cycle position and reach a view; the numbers here inform that call rather than settle it.
How to trade BNB on PrimeXBT
On PrimeXBT you can take a position on BNB in either direction. CFDs on BNB can be traded long or short, so a falling price is as tradable as a rising one — see the guide to short selling for how that works. Leverage magnifies gains and losses alike, so position sizing and a stop-loss matter on every trade. Trade on your own analysis and risk tolerance, and never risk more than you can afford to lose.
Trading involves risk.
How we build this forecast
This outlook is put together by PrimeXBT’s analysts, not lifted from a single price feed. We start from where BNB trades today, read its position against the 50- and 200-day moving averages and the key support and resistance levels, weigh the fundamentals — the quarterly burn, BNB Chain usage, ETF flows, and Binance’s regulatory standing — and set all of it against the macro backdrop, chiefly the path of U.S. interest rates. The yearly ranges combine that technical read with the fundamental and macro picture; the long-range figures lean on trajectory rather than precision.
None of this is a guarantee. Crypto is volatile, the inputs shift, and a single regulatory headline can move BNB faster than any forecast expects. Treat every figure here as a considered estimate, not a promise — we revisit and update the outlook monthly as the data changes.
How much will BNB be worth in 2026?
Our outlook averages near $685 for 2026, with the forward months in the band shown in the yearly table above. That keeps BNB in recovery, still below its October 2025 record.
How much will BNB be worth in 2030?
Our long-range view centers on an average near $1,620 for 2030, cooling gently from a 2029 peak near $1,720. Five years out, treat any single figure as a direction rather than a promise.
What will BNB be worth in five years?
See 2030 above. On this horizon the plausible range is wide, so read the number as a trajectory the burn and ecosystem growth could support, not a dated target.
Can BNB reach $2,000?
Not in our base case, which peaks near a $1,720 average in 2029. A move to $2,000 would need a stronger cycle than the current picture shows; one bank's published target does sit well above that, but it is an outlier, not a consensus.
Is BNB a good investment in 2026?
Mixed. The supply is shrinking, the regulatory overhang has eased, and a spot ETF now exists, but the price outlook is a recovery rather than a breakout, and BNB carries a Binance-specific risk. The case runs both ways.
Author



 Risk Disclaimer
The content provided here is for informational purposes only. It is not intended as personal investment advice and does not constitute a solicitation or invitation to engage in any financial transactions, investments, or related activities. Past performance is not a reliable indicator of future results.
The financial products offered by the Company are complex and come with a high risk of losing money rapidly due to leverage. These products may not be suitable for all investors. Before engaging, you should consider whether you understand how these leveraged products work and whether you can afford the high risk of losing your money.
The Company does not accept clients from the Restricted Jurisdictions as indicated in our website/ T&C. Some services or products may not be available in your jurisdiction.
The applicable legal entity and its respective products and services depend on the client’s country of residence and the entity with which the client has established a contractual relationship during registration.








