
 14 min read
 Cardano (ADA) trades near $0.19 in early August 2026, roughly 94% below the $3.10 record it set in September 2021. Cardano is a proof-of-stake layer-1 blockchain and smart-contract platform, and ADA is its native coin — used to pay network fees, secure the chain through staking, and vote in on-chain governance. This page lays out PrimeXBT’s price outlook for Cardano through 2030 and out to 2050, the technical levels traders are watching now, and the catalysts that could move the coin. Figures are given as ranges rather than false-precise targets; where the picture is genuinely uncertain, we say so.
Cardano outlook at a glance
- Current price: $0.2540 per ADA.
- 2026 base case: $0.175–$0.240, a year of basing near the lows rather than a fresh bull run.
- Main bullish catalyst: a cyclical recovery into the next Bitcoin halving window, helped by Fed rate cuts rotating capital back toward altcoins.
- Biggest downside risk: a sustained break below the $0.15 support that opens the $0.10 psychological level.
- Long-term view: the base case sees a gradual recovery, but Cardano stays well below its 2021 peak, and any figure past 2030 reads as a direction, not a target.
Live Cardano price chart
Today (August 6, 2026) Cardano (ADA/USD) is trading at $0.2540 per ADA, with a market cap of $9,422,086,291 USD. The 24-hour trading volume amounts to $777,699,151 USD. ADA price has changed by -6.65% in the last 24 hours. Cardano’s circulating supply is 36,797,328,639 ADA.
Trading involves risk.
Cardano price prediction 2026–2030 (yearly forecast)
The table sets our expected range for each year. It is built from the month-by-month path further down, so the yearly figures and the monthly ones agree by construction. Longer-horizon aggregator targets, which rest on very different assumptions and diverge sharply, are kept out of this table and dealt with separately in the analyst section.
| Year | Minimum | Average | Maximum |
|---|---|---|---|
| 2026 | $0.175 | $0.207 | $0.240 |
| 2027 | $0.204 | $0.250 | $0.309 |
| 2028 | $0.249 | $0.339 | $0.451 |
| 2029 | $0.333 | $0.430 | $0.535 |
| 2030 | $0.281 | $0.381 | $0.483 |
Cardano price prediction 2026
Our 2026 outlook keeps Cardano close to its current level, with a yearly average near $0.21 and a range of $0.175–$0.240. This is a basing year in the forecast: sentiment sits in fear, the coin trades below its long-term average, and the path is one of stabilising near the lows rather than staging a recovery. The month-by-month view for the rest of 2026:
| Month (2026) | Minimum | Average | Maximum |
|---|---|---|---|
| August | $0.175 | $0.190 | $0.205 |
| September | $0.183 | $0.200 | $0.217 |
| October | $0.192 | $0.210 | $0.228 |
| November | $0.196 | $0.215 | $0.234 |
| December | $0.200 | $0.220 | $0.240 |
Cardano price prediction 2027
2027 is where the recovery begins in our model, with a yearly average near $0.25 across a range of $0.204–$0.309. The step up is gradual and leans on the broader market cycle turning rather than on any single Cardano event. Two forks a year and steady progress on scaling support the direction, but the move is measured, not vertical.
| Month (2027) | Minimum | Average | Maximum |
|---|---|---|---|
| January | $0.204 | $0.225 | $0.246 |
| February | $0.207 | $0.229 | $0.251 |
| March | $0.211 | $0.234 | $0.257 |
| April | $0.214 | $0.238 | $0.263 |
| May | $0.218 | $0.243 | $0.268 |
| June | $0.221 | $0.248 | $0.274 |
| July | $0.225 | $0.252 | $0.280 |
| August | $0.228 | $0.257 | $0.286 |
| September | $0.231 | $0.261 | $0.291 |
| October | $0.235 | $0.266 | $0.297 |
| November | $0.238 | $0.270 | $0.303 |
| December | $0.241 | $0.275 | $0.309 |
Cardano price prediction 2028
2028 carries the recovery higher, averaging near $0.34 within a range of $0.249–$0.451. The next Bitcoin halving falls in this window, and Cardano has historically ridden the risk-appetite wave that follows it, though it has tended to lag Bitcoin on the way up. The average steps up, but stays a long way under the 2021 record.
| Month (2028) | Minimum | Average | Maximum |
|---|---|---|---|
| January | $0.249 | $0.285 | $0.321 |
| February | $0.257 | $0.295 | $0.333 |
| March | $0.265 | $0.305 | $0.345 |
| April | $0.273 | $0.315 | $0.357 |
| May | $0.281 | $0.325 | $0.369 |
| June | $0.288 | $0.335 | $0.382 |
| July | $0.296 | $0.345 | $0.393 |
| August | $0.302 | $0.354 | $0.405 |
| September | $0.309 | $0.363 | $0.416 |
| October | $0.316 | $0.372 | $0.428 |
| November | $0.323 | $0.381 | $0.439 |
| December | $0.329 | $0.390 | $0.451 |
Cardano price prediction 2029
2029 holds the cycle high in our outlook, with a yearly average near $0.44 and a range of $0.333–$0.535. Past cycles have peaked roughly 12 to 18 months after a Bitcoin halving, which places the next local top in this year. It is the most constructive year in the forecast, and also the one where the model leans hardest on the cycle repeating.
| Month (2029) | Minimum | Average | Maximum |
|---|---|---|---|
| January | $0.337 | $0.401 | $0.464 |
| February | $0.345 | $0.412 | $0.478 |
| March | $0.353 | $0.422 | $0.491 |
| April | $0.361 | $0.433 | $0.505 |
| May | $0.369 | $0.444 | $0.519 |
| June | $0.377 | $0.455 | $0.533 |
| July | $0.376 | $0.455 | $0.535 |
| August | $0.367 | $0.446 | $0.525 |
| September | $0.359 | $0.437 | $0.516 |
| October | $0.350 | $0.428 | $0.506 |
| November | $0.342 | $0.419 | $0.497 |
| December | $0.333 | $0.410 | $0.487 |
Cardano price prediction 2030
Our 2030 view averages near $0.38 across a range of $0.281–$0.483 — a cool-down after the 2029 peak rather than a fresh leg higher. Five years out the outlook leans on trajectory over precision, so read the month-by-month path below as a shape, not a set of dated targets.
| Month (2030) | Minimum | Average | Maximum |
|---|---|---|---|
| January | $0.328 | $0.405 | $0.483 |
| February | $0.323 | $0.401 | $0.478 |
| March | $0.319 | $0.396 | $0.474 |
| April | $0.314 | $0.392 | $0.469 |
| May | $0.309 | $0.387 | $0.465 |
| June | $0.304 | $0.382 | $0.460 |
| July | $0.300 | $0.378 | $0.456 |
| August | $0.296 | $0.375 | $0.453 |
| September | $0.292 | $0.371 | $0.450 |
| October | $0.288 | $0.367 | $0.446 |
| November | $0.285 | $0.364 | $0.443 |
| December | $0.281 | $0.360 | $0.439 |
Cardano long-term price prediction: 2035, 2040–2050
Forecasts this far out are estimates dressed as numbers. No model can price a decade of halving cycles, protocol changes, and macro regimes that do not exist yet, so treat the figures below as a rough trajectory, with error bars that widen every year out. On our long-range path Cardano trends higher without ever hockey-sticking, and a yearly average near $0.50 in 2035, $0.70 in 2040, and $1.10 in 2050 still leaves the coin short of its 2021 record.
| Year | Minimum | Average | Maximum |
|---|---|---|---|
| 2035 | $0.370 | $0.500 | $0.630 |
| 2040 | $0.476 | $0.700 | $0.924 |
| 2050 | $0.660 | $1.100 | $1.540 |
What analysts and models say (compared)
Cardano forecasts sit unusually far apart right now, and the gap is the point. Algorithmic models that anchor to the current price and recent momentum extrapolate the downtrend and see ADA drifting lower into 2030. Models still anchored to Cardano’s higher pre-slump prices project a recovery back above $1. Averaging figures built on incompatible starting points would mislead, so they are laid out side by side.
| Source | Method | Cardano view |
|---|---|---|
| Changelly | Algorithmic | 2026 avg ~$0.18; 2030 avg ~$0.06 (momentum-driven, bearish) |
| CoinGape | Algorithmic | 2026 avg ~$0.21; 2030 avg ~$0.08 |
| LiteFinance (aggregate of CoinCodex, DigitalCoinPrice, Changelly) | Blended algorithmic | 2026 avg ~$0.28; 2030 avg ~$0.13 |
| DigitalCoinPrice | Algorithmic | 2026 avg ~$1.32; 2030 ~$2.5 (anchored to higher prior prices) |
The spread is enormous: for 2030, one model sees roughly $0.06 while another sees $2.50, a 40-fold difference for the same coin in the same year. That range is not a rounding problem, it is a disagreement about whether Cardano is near a cycle bottom or in structural decline. Named institutions rarely publish ADA-specific price targets the way they do for Bitcoin or Ethereum, so there is no bank call to anchor to here. Anyone hunting for a single consensus number for Cardano will not find one.
Track record of this forecast
This is the first published PrimeXBT price forecast for Cardano. From the next monthly review onward, this section will compare the previous forecast against ADA’s actual price on the update date, and explain any miss rather than smoothing it over.
Cardano technical analysis
Cardano sits between its two most-watched moving averages. It trades below the 200-day moving average near $0.26 — a sign the longer trend is still down — but holds around its 50-day average near $0.17, which shows it has steadied off its local lows. The RSI has held in neutral territory through early August, neither overbought nor oversold, with readings that swing between the mid-40s and mid-60s depending on the timeframe. The Fear & Greed Index reads 27 (Fear), and Bitcoin dominance near 56% points to capital still favouring Bitcoin over altcoins.
The support and resistance levels that matter now: support at $0.17, then $0.15, with a deeper floor near $0.138 and the $0.10 round number below that; resistance at $0.20, then $0.22, with the 200-day average near $0.26 as the line the longer trend has to reclaim. A daily close back above $0.26 would be the clearest signal that the downtrend has turned. For a primer on reading these signals, see PrimeXBT’s guide to crypto technical analysis.
Correlation with other assets
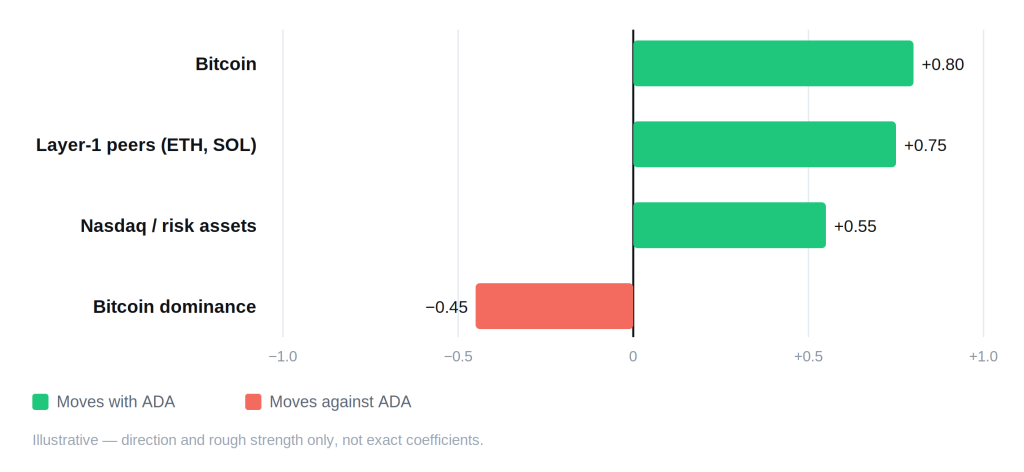
Cardano trades as a high-beta bet on the broader crypto market. Its direction is set first by Bitcoin: when Bitcoin rises, ADA usually rises more, and when Bitcoin falls, ADA usually falls harder. It also moves in close step with the other large smart-contract platforms — Ethereum and Solana — since the market tends to reprice the whole layer-1 group together. The link to Bitcoin dominance is the one traders watch most: when dominance climbs, as it has near 56% lately, altcoins including Cardano tend to underperform; when it falls in an “altseason,” ADA is among the coins that outperform. As a risk-on asset, Cardano has tracked equity indices like the Nasdaq more closely since institutions entered crypto, which is why Fed policy now shows up quickly in its price. Unlike Bitcoin, ADA carries no “digital gold” story, so it has little meaningful relationship with gold or the dollar index. These are directional tendencies, not fixed coefficients, and they shift over time.
Fundamental factors
Cardano’s pitch has always been engineering over hype. The network runs on Ouroboros, a proof-of-stake protocol built through peer-reviewed academic research under Input Output (IOHK) and co-founder Charles Hoskinson, and it uses an extended UTXO (eUTXO) accounting model rather than the account model Ethereum uses. Smart contracts run in Plutus, and ADA holders can delegate their coins to stake pools to help secure the chain and earn a native yield of roughly 2.1% to 2.2% a year, with a large portion of supply staked at any given time. That staking demand keeps a meaningful share of ADA locked rather than for sale.
Supply is capped: Cardano will never exceed 45 billion ADA, and roughly 36.5 billion is already in circulation, so the inflation runway is short compared with uncapped chains. On development, the network moved into its Voltaire governance era — on-chain voting and a community treasury — and on July 18, 2026 activated the van Rossem hard fork, its first upgrade ratified entirely through on-chain governance, which lifted the chain to Protocol Version 11 and cut costs for some Plutus operations. The larger prize is scaling: Ouroboros Leios, expected via the coming Dijkstra-era hard fork, aims to raise throughput sharply. No mainnet date for Leios has been confirmed at the time of writing, so it is not treated as a dated catalyst below.
Upcoming catalysts
Only confirmed, dated events are listed. Macro policy is the clearest near-term driver, given how closely Cardano now tracks risk assets.
| Date | Event | Potential impact |
|---|---|---|
| September 15–16, 2026 | FOMC meeting (with economic projections) | Bull if the Fed signals cuts; bear if it holds rates higher for longer |
| October 27–28, 2026 | FOMC meeting | Rate path drives risk appetite across crypto |
| December 8–9, 2026 | FOMC meeting (with economic projections) | Year-end policy signal for 2027 positioning |
| 2026 (date not yet confirmed) | Ouroboros Leios scaling upgrade (Dijkstra-era hard fork) | Higher throughput; no mainnet date announced yet |
FOMC dates follow the Federal Reserve’s published 2026 schedule. Leios is listed without a date because none has been confirmed — an estimated date would be a guess, not information.
Bull case vs bear case
Bull case:
- The Fed shifts to rate cuts and capital rotates back into altcoins, with Cardano’s high beta amplifying the move.
- Bitcoin dominance rolls over into an altseason, the setup in which ADA has historically outperformed.
- Leios ships and lifts throughput, giving Cardano a concrete scaling story to trade on.
- Staking keeps a large share of supply locked, thinning the float available to sell.
Bear case:
- Rates stay higher for longer, keeping risk assets and altcoins under pressure.
- Bitcoin dominance keeps climbing and Cardano keeps lagging, stuck below its 200-day average.
- Momentum models prove right and the downtrend extends toward the $0.10 area.
- Rival smart-contract chains capture developer activity faster than Cardano ships upgrades.
Invalidation levels. The bull case weakens if Cardano closes below $0.15, the support that has held the recent range; losing it opens the $0.138 floor and then $0.10. The bear case is invalidated on a sustained break above $0.22 and, more decisively, a reclaim of the 200-day average near $0.26 — the line that would mark the longer downtrend as broken. These are the same levels from the technical section, not separate numbers.
Historical performance
Cardano’s chart is a story of one dominant cycle, not a steady climb. ADA launched in 2017, ran to an intraday record of $3.10 in September 2021, then gave back the vast majority of that value over the following years. In early August 2026 it trades roughly 94% below that peak and below its own 200-day average. The pattern of sharp cycle tops and long, grinding recoveries is the shape that matters here — and no cycle is obliged to repeat the last one.
Is Cardano a good investment in 2026?
The answer depends on time horizon and risk tolerance. Our outlook sees Cardano basing near the lows into year-end — a yearly average near $0.21 for 2026 — with a cyclical recovery only building from 2027. The facts underneath are plain: ADA sits well below its long-term average, sentiment is fearful, Bitcoin is soaking up the market’s risk budget, and the near-term path runs through Fed policy. The fundamentals — capped supply, staking demand, a working governance system, and a scaling roadmap — are steadier than the price. Whether that reads as an opportunity near a cycle low or a coin still in decline is the reader’s call. PrimeXBT’s explainer on whether Cardano is a good investment works through the case in more detail.
How to trade Cardano on PrimeXBT
On PrimeXBT you can take a position on Cardano in either direction. CFDs on ADA can be traded long or short, so the same market works whether you expect the price to rise or fall. Leverage magnifies gains and losses alike, so position sizing and a stop-loss matter on any trade. Trade on your own analysis and risk tolerance, and never risk more than you can afford to lose.
Trading involves risk.
How we build this forecast
This outlook is put together by PrimeXBT’s analysts, not lifted from a single price feed. We start from where Cardano trades today, read its position against the 50- and 200-day moving averages and the key support and resistance levels, weigh the fundamentals — staking demand, capped supply, governance, and the Leios scaling roadmap — and set all of it against the macro backdrop, chiefly the path of U.S. interest rates and Bitcoin dominance. The yearly ranges combine that technical read with the fundamental and cycle picture; the long-range figures lean on trajectory rather than precision.
None of this is a guarantee. Crypto is volatile, the inputs shift, and a single macro surprise can move Cardano faster than any forecast expects. Treat every figure here as a considered estimate, not a promise — we revisit and update the outlook monthly as the data changes.
How much will Cardano be worth in 2026?
Our outlook is $0.175–$0.240 for 2026, averaging near $0.21 — a basing year near the current price rather than a recovery.
What will Cardano be worth in five years?
See 2030 above. On this horizon, treat any single number as a direction rather than a target — the plausible range is wide, and models for 2030 run from roughly $0.06 to $2.50.
Will Cardano reach $10?
Not on our numbers. Our modeled path keeps Cardano's yearly average near or below $1.10 even in 2050, far short of $10. Reaching that would take a far stronger multi-cycle run than the current picture supports.
Can Cardano reach $100?
No. At $100 Cardano's market value would dwarf the entire crypto market as it stands today, and nothing in our forecast points there. It is not a realistic target on any horizon we model.
Author



 Risk Disclaimer
The content provided here is for informational purposes only. It is not intended as personal investment advice and does not constitute a solicitation or invitation to engage in any financial transactions, investments, or related activities. Past performance is not a reliable indicator of future results.
The financial products offered by the Company are complex and come with a high risk of losing money rapidly due to leverage. These products may not be suitable for all investors. Before engaging, you should consider whether you understand how these leveraged products work and whether you can afford the high risk of losing your money.
The Company does not accept clients from the Restricted Jurisdictions as indicated in our website/ T&C. Some services or products may not be available in your jurisdiction.
The applicable legal entity and its respective products and services depend on the client’s country of residence and the entity with which the client has established a contractual relationship during registration.








