14 min read
 Cosmos (ATOM) trades near $1.35 in early August 2026, more than 95% below the record it set in 2021. ATOM is the staking and governance token of the Cosmos Hub, the central chain of an ecosystem that markets itself as the “Internet of Blockchains”, a web of independent networks that talk to each other through the Cosmos inter-blockchain messaging standard. This page lays out PrimeXBT’s price outlook for ATOM through 2030 and out to 2050, the technical levels traders are watching now, and the catalysts that could shift the picture. Every number here is an estimate, wide by design and wider the further out it reaches, and where the evidence runs thin we say so rather than dress a guess as a target.
Cosmos outlook at a glance
- Current price: $1.744 per ATOM.
- 2026 base case: $1.242–$1.582, averaging near $1.40, closer to a floor-hunting year than a recovery.
- Main bullish catalyst: a broad altcoin rotation into the 2028–2029 window, amplified if the Cosmos Hub finally fixes how ATOM captures ecosystem value.
- Biggest downside risk: persistent inflation and weak value capture keep sellers in control, with a break below the $1.19 support opening lower ground.
- Long-term view: a gradual recovery is the base case, but any figure past 2030 is a direction of travel, not a price you can hold us to.
Live Cosmos price chart
Today (4 October 2026) Cosmos (ATOM/USD) is trading at $1.744 per ATOM, with a market cap of $935,801,910 USD. The 24-hour trading volume amounts to $42,109,462 USD. ATOM price has changed by 2.35% in the last 24 hours. Cosmos’s circulating supply is 533,894,032 ATOM.
Trading involves risk.
Cosmos price prediction 2026–2030 (yearly forecast)
The table sets PrimeXBT’s expected range for each year. Institutional and algorithmic forecasts for ATOM sit unusually far apart, so the sharply higher and lower outside views are kept in the analyst section rather than blended into these ranges.
| Year | Minimum | Average | Maximum |
|---|---|---|---|
| 2026 | $1.242 | $1.400 | $1.582 |
| 2027 | $1.356 | $1.735 | $2.190 |
| 2028 | $1.772 | $2.408 | $3.143 |
| 2029 | $2.359 | $3.060 | $3.790 |
| 2030 | $2.067 | $2.805 | $3.535 |
Cosmos price prediction 2026
The 2026 outlook keeps ATOM close to its early-August level near $1.35, a full-year range of $1.242–$1.582 averaging near $1.40. That is a year spent building a base under a long downtrend, not turning it, with price still pinned below every major moving average.
For the rest of 2026, the month-by-month path holds ATOM in a narrow band that drifts sideways rather than trends:
| Month (2026) | Minimum | Average | Maximum |
|---|---|---|---|
| August | $1.242 | $1.350 | $1.458 |
| September | $1.261 | $1.375 | $1.489 |
| October | $1.280 | $1.400 | $1.520 |
| November | $1.299 | $1.425 | $1.551 |
| December | $1.318 | $1.450 | $1.582 |
Cosmos price prediction 2027
2027 is the first repair year: the path lifts off the base toward an average near $1.75, inside a full-year range of $1.356–$2.190. The step up leans on a wider crypto recovery rather than anything specific to the Cosmos Hub, because ATOM’s own value-capture question is unlikely to be settled that quickly.
| Month (2027) | Minimum | Average | Maximum |
|---|---|---|---|
| January | $1.356 | $1.496 | $1.636 |
| February | $1.394 | $1.542 | $1.691 |
| March | $1.431 | $1.588 | $1.745 |
| April | $1.469 | $1.635 | $1.801 |
| May | $1.506 | $1.681 | $1.856 |
| June | $1.542 | $1.727 | $1.912 |
| July | $1.574 | $1.768 | $1.962 |
| August | $1.602 | $1.805 | $2.007 |
| September | $1.629 | $1.841 | $2.053 |
| October | $1.656 | $1.877 | $2.098 |
| November | $1.683 | $1.914 | $2.144 |
| December | $1.710 | $1.950 | $2.190 |
Cosmos price prediction 2028
2028 carries ATOM higher as the broader market moves into a post-halving upswing, averaging near $2.40 across a range of $1.772–$3.143. This is the year the cyclical tailwind does most of the work, lifting the whole large-cap altcoin cohort with ATOM riding along.
| Month (2028) | Minimum | Average | Maximum |
|---|---|---|---|
| January | $1.772 | $2.027 | $2.282 |
| February | $1.834 | $2.104 | $2.374 |
| March | $1.895 | $2.181 | $2.467 |
| April | $1.956 | $2.258 | $2.560 |
| May | $2.016 | $2.335 | $2.653 |
| June | $2.076 | $2.412 | $2.747 |
| July | $2.123 | $2.475 | $2.826 |
| August | $2.159 | $2.524 | $2.889 |
| September | $2.194 | $2.573 | $2.952 |
| October | $2.229 | $2.622 | $3.015 |
| November | $2.263 | $2.671 | $3.079 |
| December | $2.297 | $2.720 | $3.143 |
Cosmos price prediction 2029
2029 holds the cycle high in this forecast, an average near $3.05 inside a range of $2.359–$3.790. PrimeXBT places ATOM’s next peak in this window, roughly 12 to 18 months after the 2028 Bitcoin halving, the lag that has framed past altcoin tops.
| Month (2029) | Minimum | Average | Maximum |
|---|---|---|---|
| January | $2.359 | $2.802 | $3.244 |
| February | $2.420 | $2.883 | $3.347 |
| March | $2.480 | $2.965 | $3.449 |
| April | $2.540 | $3.046 | $3.552 |
| May | $2.600 | $3.128 | $3.656 |
| June | $2.659 | $3.209 | $3.760 |
| July | $2.665 | $3.227 | $3.790 |
| August | $2.619 | $3.182 | $3.745 |
| September | $2.573 | $3.136 | $3.700 |
| October | $2.527 | $3.091 | $3.654 |
| November | $2.482 | $3.045 | $3.609 |
| December | $2.437 | $3.000 | $3.563 |
Cosmos price prediction 2030
The 2030 view cools off the peak to an average near $2.80, spanning $2.067–$3.535. Five years out the outlook rests on trajectory rather than precision, so read the monthly path below as a curve, not a set of dated prices to trade against.
| Month (2030) | Minimum | Average | Maximum |
|---|---|---|---|
| January | $2.404 | $2.969 | $3.535 |
| February | $2.371 | $2.938 | $3.506 |
| March | $2.338 | $2.908 | $3.477 |
| April | $2.306 | $2.877 | $3.448 |
| May | $2.274 | $2.846 | $3.419 |
| June | $2.241 | $2.815 | $3.389 |
| July | $2.211 | $2.786 | $3.362 |
| August | $2.182 | $2.759 | $3.336 |
| September | $2.153 | $2.732 | $3.311 |
| October | $2.124 | $2.705 | $3.285 |
| November | $2.095 | $2.677 | $3.259 |
| December | $2.067 | $2.650 | $3.233 |
Cosmos long-term price prediction: 2035, 2040–2050
Stretch the horizon to a decade and the honest answer is that no model can see that far. A ten-year ATOM price has to guess at halving cycles that haven’t happened, competing tech that hasn’t shipped, and whether Cosmos ever solves the value-capture problem described below, so treat every figure here as a rough arc that widens into a fog the further right you read. On that basis, PrimeXBT’s long-range path climbs slowly, with an average near $4.20 by 2035, near $6.00 by 2040, and near $9.50 by 2050, and it never assumes a return to old highs:
| Year | Minimum | Average | Maximum |
|---|---|---|---|
| 2035 | $3.108 | $4.200 | $5.292 |
| 2040 | $4.080 | $6.000 | $7.920 |
| 2050 | $5.700 | $9.500 | $13.300 |
What analysts and models say (compared)
Few coins split forecasters as cleanly as ATOM. One camp of algorithmic models extrapolates the downtrend and sees ATOM below $1 by 2030; another projects a multiple of today’s price. Averaging views built on opposite assumptions would produce a number that describes no one’s actual thesis, so they are set side by side instead.
| Source | Method | Cosmos (ATOM) view |
|---|---|---|
| Changelly | Algorithmic | 2026 avg ~$1.40; 2030 avg ~$0.65 |
| CoinCodex | Algorithmic | 2026 ~$1.29 year-end; 2030 ~$0.64 year-end |
| CoinDataFlow | Algorithmic | 2028 avg ~$2.00; 2030 avg ~$5.04 |
| Cryptopolitan | Algorithmic | 2030 avg ~$8.90; 2032 avg ~$18.20 |
| DigitalCoinPrice | Algorithmic | 2026 avg ~$10.93; 2030 avg ~$24.47 |
The disagreement is the signal. Momentum-driven models such as Changelly and CoinCodex read the past two years and project more of the same, landing well under $1 by 2030. Trend-recovery models such as CoinDataFlow, Cryptopolitan, and DigitalCoinPrice assume mean reversion and a fresh cycle, and reach for figures many times higher. PrimeXBT’s own ranges sit deliberately between the two poles: a recovery, but a measured one that respects the structural drag on ATOM rather than pricing it away.
Track record of this forecast
This is the first ATOM forecast PrimeXBT has published, so there is no prior call to grade yet. Each monthly update from here will reprint the previous numbers next to ATOM’s actual price on the review date and account for the gap, especially when the gap is large.
Cosmos technical analysis
As of early August 2026, ATOM trades below both of its most-watched moving averages: under the 50-day simple moving average near $1.51 and well under the 200-day near $1.83. Price sitting below both lines, with the shorter average beneath the longer one, is the textbook shape of a market still in a downtrend rather than one turning up. The RSI reads around 42 on the daily chart, neutral and leaning soft, with no oversold washout that often marks a bottom.
The support and resistance levels that matter now: support at $1.28, then $1.19, the floor of the recent range; resistance at $1.42, then $1.52, which lines up almost exactly with the 50-day average. Reclaiming that $1.52 zone and holding it would be the first evidence the selling has run its course; a daily close under $1.19 would say the opposite. Broader sentiment matches the chart, with the Fear and Greed Index parked in Fear near 29. For a primer on reading these signals, see PrimeXBT’s guide to crypto technical analysis.
Correlation with other assets
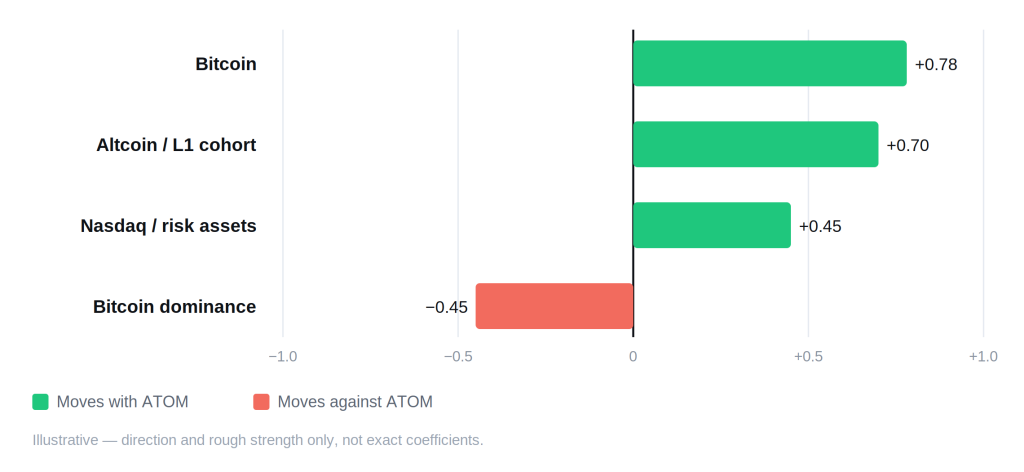
ATOM behaves like a high-beta bet on the broad altcoin market. It rises harder than Bitcoin in rallies and falls harder in selloffs, and it moves in step with the wider layer-1 cohort it competes in, coins like its long-standing rival Polkadot. When capital rotates toward Bitcoin and Bitcoin dominance climbs, ATOM tends to bleed relative to the majors, which is a recurring headwind in this cycle. Since institutions entered crypto, ATOM has also tracked risk-on assets like the Nasdaq more closely, so Federal Reserve policy now leaks into its price. What makes ATOM distinct is a self-inflicted drag no chart captures: the token does not directly capture the value of the many chains built with Cosmos technology, so even genuine ecosystem growth often fails to lift ATOM. Unlike Bitcoin, it carries no safe-haven or dollar-hedge story, so there is little to cushion it when risk appetite drains.
Fundamental factors
Cosmos is not a single blockchain but a toolkit for building many. Its Cosmos SDK and the CometBFT (formerly Tendermint) proof-of-stake engine let teams launch sovereign, application-specific chains, and its Inter-Blockchain Communication protocol (IBC) lets those chains move tokens and data between one another. The approach has been widely adopted: dYdX, Celestia, Injective, and dozens of other networks are built with Cosmos tooling. ATOM sits at the center as the token that secures the Cosmos Hub and is staked to validate it, recently paying yields around 15% to 20% a year.
Those yields are the catch. ATOM has no hard cap like Bitcoin’s 21 million; new tokens are minted continuously to fund staking rewards, so the high headline yield is largely inflation handed back to stakers while diluting anyone who does not stake. Circulating supply stands near 523 million ATOM. The community capped maximum inflation at 10% in a late-2023 vote and then rejected a 2024 proposal to cut minimum inflation to zero, judging that emissions still pay for network security. Sitting underneath all of it is the value-capture debate that has shadowed ATOM for years: because sovereign chains do not owe fees or security payments to the Hub by default, Cosmos can grow while ATOM does not. The ambitious ATOM 2.0 overhaul meant to address this was rejected in 2022, and later fixes, Interchain Security (also called replicated security, where the Hub rents its validator set to smaller chains) and a “Hub minimalism” push to keep the Hub lean, have chipped at the problem without resolving it. Whether Cosmos closes this gap is the single fundamental that matters most for ATOM’s long-run price.
Upcoming catalysts
Only confirmed, dated events are listed. With ATOM tracking risk assets, U.S. monetary policy is the clearest near-term driver; Cosmos-specific catalysts tend to arrive as governance votes without fixed calendar dates.
| Date | Event | Potential impact |
|---|---|---|
| September 15–16, 2026 | FOMC meeting (with economic projections) | Bull if the Fed signals cuts; bear if it holds rates higher for longer |
| October 27–28, 2026 | FOMC meeting | Rate path steers risk appetite across the altcoin market |
| December 8–9, 2026 | FOMC meeting (with economic projections) | Year-end policy signal that frames 2027 positioning |
FOMC dates follow the Federal Reserve’s published 2026 schedule. No dated Cosmos Hub upgrade or value-capture vote is confirmed at the time of writing, so none is listed; an invented date would be a guess, not a catalyst.
Bull case vs bear case
Bull case:
- A broad altcoin rotation into 2028–2029 lifts high-beta layer-1s, and ATOM rides the cohort higher.
- The Fed eases, and capital flows back toward risk assets including mid-cap crypto.
- Interchain Security wins enough consumer chains that ATOM finally captures a slice of the value it secures.
- Governance tightens emissions further, easing the inflation drag on holders.
Bear case:
- The value-capture gap stays open, so Cosmos ecosystem growth keeps bypassing ATOM.
- Double-digit inflation keeps diluting non-stakers and pressuring the price.
- Rising Bitcoin dominance leaves altcoins like ATOM lagging the majors.
- Competing interoperability and app-chain platforms erode ATOM’s role.
Invalidation levels. The bullish path loses conviction if ATOM closes below $1.19, the base of the current range, which would open a retest of lower ground. The bearish path is called into question on a sustained reclaim of $1.52, the resistance that coincides with the 50-day average, and more firmly on a recovery of the 200-day average near $1.83, the line that would mark the long downtrend as broken. From spot near $1.35, that first downside trigger sits roughly 12% below and the decisive upside line about 36% above.
Historical performance
ATOM’s chart is a story of one euphoric peak and a long descent. After launching in 2019, it rode the 2021 bull market to a record of $44.70 in September 2021, then gave almost all of it back, and by mid-2026 it changes hands at a small fraction of that high. The drawdown has run deeper and lasted longer than most large-cap peers, which is exactly why the value-capture question dominates any serious ATOM forecast. Past cycles show the token can move violently when risk appetite returns; none of them guarantee it reclaims old ground.
Is Cosmos a good investment in 2026?
It comes down to whether you are buying the technology or the token, because with ATOM those are not the same bet. PrimeXBT’s outlook sees ATOM averaging near $1.40 through 2026, a base-building year rather than a breakout, with a modest recovery only later in the decade. The technology is widely used and the IBC network keeps expanding; the token still struggles to turn that adoption into price because of inflation and weak value capture. Sentiment sits in Fear and price trades below its long-term average. For traders that mix can read as a beaten-down entry or a value trap, and PrimeXBT’s explainer on what Cosmos is and how it works lays out the mechanics behind the debate.
How to trade Cosmos on PrimeXBT
On PrimeXBT you can take a position on Cosmos in either direction. CFDs on ATOM can be traded long or short, so a bearish read is as tradable as a bullish one, with short selling covered in PrimeXBT’s guide. Leverage magnifies gains and losses in equal measure, so position sizing and a stop-loss carry real weight on any trade. Trade on your own analysis and risk tolerance, and never stake more than you can afford to lose.
Trading involves risk.
How we build this forecast
PrimeXBT’s analysts assemble this outlook rather than copy it from one price feed. The starting point is where ATOM trades today and how it sits against its 50- and 200-day moving averages and the nearby support and resistance. On top of that we weigh the fundamentals that make ATOM unusual, chiefly its inflation schedule, staking economics, and the unresolved value-capture problem, then set the whole picture against the macro backdrop, above all the path of U.S. interest rates. The yearly ranges fuse that technical read with the fundamental and macro view; the long-range numbers lean on the shape of the trajectory rather than any claim to precision.
None of this is a promise. Crypto is volatile, the inputs move, and a single governance vote or macro shock can push ATOM further than any model expects. Treat every figure as a considered estimate, and note that we revise this outlook monthly as the data changes.
How much will Cosmos be worth in 2026?
PrimeXBT's outlook for 2026 is roughly $1.242–$1.582, averaging near $1.40, a year of consolidation rather than recovery.
How much will Cosmos be worth in 2030?
The 2030 view is roughly $2.067–$3.535, averaging near $2.80. On a five-year horizon a single number carries little precision, so treat it as a direction rather than a target.
Can Cosmos (ATOM) reach $100?
Not on these numbers. The top of PrimeXBT's modeled range peaks in the low single digits around 2029, and $100 would require roughly a 74x move from today's price, far beyond anything the current fundamentals or any mainstream model support.
Is Cosmos a good investment in 2026?
It is a split picture: widely used technology, but a token weighed down by inflation and weak value capture, trading below its long-term average with fearful sentiment. The case runs both ways, and the answer depends on whether you are backing the network or ATOM itself.
Why does ATOM keep falling when Cosmos keeps growing?
Because ATOM does not automatically capture the value of the chains built with Cosmos technology. Sovereign app-chains owe the Cosmos Hub nothing by default, and continuous token inflation dilutes holders, so ecosystem adoption and ATOM's price have often moved in opposite directions.
Author



 Risk Disclaimer
The content provided here is for informational purposes only. It is not intended as personal investment advice and does not constitute a solicitation or invitation to engage in any financial transactions, investments, or related activities. Past performance is not a reliable indicator of future results.
The financial products offered by the Company are complex and come with a high risk of losing money rapidly due to leverage. These products may not be suitable for all investors. Before engaging, you should consider whether you understand how these leveraged products work and whether you can afford the high risk of losing your money.
The Company does not accept clients from the Restricted Jurisdictions as indicated in our website/ T&C. Some services or products may not be available in your jurisdiction.
The applicable legal entity and its respective products and services depend on the client’s country of residence and the entity with which the client has established a contractual relationship during registration.