14 min read
 XRP is the native digital asset of the XRP Ledger, a decentralized layer-1 blockchain built for fast, low-cost cross-border payments and settlement, and used by Ripple in its enterprise payment products. In early August 2026 it trades near $1.07, more than 70% below the $3.65 record high it set in July 2025 and roughly half its January 2026 level. This page sets out PrimeXBT’s price outlook for XRP through 2030 and out to 2050, the technical levels traders are watching now, and the catalysts that could move the price. The outlook is built on current market data and given as ranges, not false-precise numbers; where the picture is genuinely uncertain, we say so.
XRP outlook at a glance
- Current price: $1.4105 per XRP.
- 2026 base case: a consolidation year in roughly $1.00–$1.40, averaging near $1.20, with no return to the 2025 high.
- Main bullish catalyst: Fed rate cuts, renewed spot XRP ETF inflows, and U.S. market-structure legislation that finally clears, lifting XRP back above its 200-day average near $1.38.
- Biggest downside risk: higher-for-longer Fed policy and a sustained break below the $1.00 support that has held since late June.
- Long-term view: a gradual, multi-year recovery is the base case, but forecasts beyond 2030 read as directional scenarios, not precise targets.
Live XRP price chart
Today (12 October 2026) XRP (XRP/USD) is trading at $1.4105 per XRP, with a market cap of $89,219,596,079 USD. The 24-hour trading volume amounts to $1,372,876,257 USD. XRP price has changed by 1.45% in the last 24 hours. XRP’s circulating supply is 63,129,671,205 XRP.
Trading involves risk.
XRP price prediction 2026–2030 (yearly forecast)
The table sets our expected range for each year, derived from the month-by-month path in the sections below. Longer-horizon institutional targets, which rest on different assumptions and diverge sharply, are kept separate in the analyst section rather than blended in here.
| Year | Minimum | Average | Maximum |
|---|---|---|---|
| 2026 | ~$1.02 | ~$1.20 | ~$1.40 |
| 2027 | ~$1.22 | ~$1.47 | ~$1.79 |
| 2028 | ~$1.50 | ~$1.84 | ~$2.22 |
| 2029 | ~$1.77 | ~$2.31 | ~$3.26 |
| 2030 | ~$2.57 | ~$3.57 | ~$4.58 |
XRP price prediction 2026
Our 2026 outlook keeps XRP boxed into a consolidation band of roughly $1.00–$1.40, averaging near $1.20, with the 200-day average near $1.38 acting as the ceiling on any rally. That is the signature of a market repairing itself after a 70% drawdown, not one starting a fresh bull run. The psychological $1.00 line, defended repeatedly since late June, is the floor the whole year leans on.
For the rest of 2026, our month-by-month view holds XRP in that band, with attempts toward the $1.50s capped and pullbacks bought near the dollar:
| Month (2026) | Minimum | Average | Maximum |
|---|---|---|---|
| August | $1.02 | $1.10 | $1.18 |
| September | $1.07 | $1.15 | $1.23 |
| October | $1.11 | $1.20 | $1.29 |
| November | $1.16 | $1.25 | $1.34 |
| December | $1.20 | $1.30 | $1.40 |
XRP price prediction 2027
2027 is a slow grind rather than a breakout: the path works higher through the year for a full-year range of about $1.20–$1.80, averaging near $1.47. The step up rests on firmer payment volume and clearer U.S. rules, not a single event. XRP spends much of the year reclaiming and then defending the levels that capped it in 2026.
| Month (2027) | Minimum | Average | Maximum |
|---|---|---|---|
| January | $1.22 | $1.32 | $1.43 |
| February | $1.24 | $1.35 | $1.45 |
| March | $1.26 | $1.37 | $1.48 |
| April | $1.28 | $1.39 | $1.51 |
| May | $1.29 | $1.42 | $1.54 |
| June | $1.31 | $1.44 | $1.56 |
| July | $1.34 | $1.47 | $1.60 |
| August | $1.36 | $1.50 | $1.64 |
| September | $1.39 | $1.53 | $1.68 |
| October | $1.42 | $1.57 | $1.71 |
| November | $1.45 | $1.60 | $1.75 |
| December | $1.47 | $1.63 | $1.79 |
XRP price prediction 2028
2028 is the first clear recovery year: the outlook ranges about $1.50–$2.20 and averages near $1.85, with XRP trading back above its long-term moving averages for the first time in the forecast. The move rests on accumulated adoption and a friendlier macro backdrop rather than one catalyst.
| Month (2028) | Minimum | Average | Maximum |
|---|---|---|---|
| January | $1.50 | $1.67 | $1.83 |
| February | $1.53 | $1.70 | $1.87 |
| March | $1.56 | $1.73 | $1.91 |
| April | $1.58 | $1.77 | $1.95 |
| May | $1.61 | $1.80 | $1.99 |
| June | $1.64 | $1.83 | $2.03 |
| July | $1.66 | $1.86 | $2.07 |
| August | $1.68 | $1.89 | $2.10 |
| September | $1.70 | $1.91 | $2.13 |
| October | $1.71 | $1.94 | $2.16 |
| November | $1.73 | $1.96 | $2.19 |
| December | $1.75 | $1.99 | $2.22 |
XRP price prediction 2029
2029 sets up the next up-leg: a range of roughly $1.75–$3.25 averaging near $2.30, widening as the year runs on. The band is deliberately wide because a cyclical acceleration typically begins in this window, and the top of the range depends on whether that momentum arrives early or late.
| Month (2029) | Minimum | Average | Maximum |
|---|---|---|---|
| January | $1.77 | $2.01 | $2.25 |
| February | $1.79 | $2.04 | $2.29 |
| March | $1.81 | $2.06 | $2.32 |
| April | $1.83 | $2.09 | $2.35 |
| May | $1.84 | $2.11 | $2.38 |
| June | $1.86 | $2.14 | $2.41 |
| July | $1.93 | $2.21 | $2.50 |
| August | $2.03 | $2.34 | $2.65 |
| September | $2.14 | $2.47 | $2.80 |
| October | $2.25 | $2.60 | $2.96 |
| November | $2.36 | $2.73 | $3.11 |
| December | $2.46 | $2.86 | $3.26 |
XRP price prediction 2030
Our 2030 view is the cycle peak of the forecast: roughly $2.60–$4.60, averaging near $3.55, which would finally revisit and test the 2025 record high. Five years out the outlook leans on trajectory over precision, so read the month-by-month path below as a shape, not a set of dated targets.
| Month (2030) | Minimum | Average | Maximum |
|---|---|---|---|
| January | $2.57 | $2.99 | $3.41 |
| February | $2.67 | $3.12 | $3.56 |
| March | $2.78 | $3.25 | $3.72 |
| April | $2.88 | $3.38 | $3.87 |
| May | $2.99 | $3.51 | $4.02 |
| June | $3.09 | $3.64 | $4.18 |
| July | $3.16 | $3.72 | $4.29 |
| August | $3.19 | $3.77 | $4.35 |
| September | $3.22 | $3.81 | $4.40 |
| October | $3.25 | $3.86 | $4.46 |
| November | $3.29 | $3.90 | $4.52 |
| December | $3.32 | $3.95 | $4.58 |
XRP long-term price prediction: 2035, 2040–2050
Forecasts this far out are guesses dressed as numbers. No model can price a decade of liquidity cycles, payment-network adoption, and macro regimes that don’t exist yet, so read everything below as a rough trajectory rather than a target, with error bars that widen every year out. With that caveat, our long-range path trends steadily higher without hockey-sticking: an average near $4.30 in 2035, near $5.20 in 2040, and near $8.70 in 2050.
| Year | Minimum | Average | Maximum |
|---|---|---|---|
| 2035 | $3.65 | $4.30 | $4.94 |
| 2040 | $4.16 | $5.20 | $6.24 |
| 2050 | $6.52 | $8.70 | $10.88 |
What analysts and models say (compared)
XRP forecasts sit unusually far apart for 2026. Algorithmic models cluster near $1.15–$1.35 for the year, while at least one major bank published a target several times higher. Averaging figures built on incompatible assumptions would mislead, so they are laid out side by side instead.
| Source | Method | XRP view (2026 unless noted) |
|---|---|---|
| CoinCodex | Algorithmic | 2026 avg ~$1.35 (range ~$1.07–$1.68); 2030 avg ~$3.67 |
| Changelly | Algorithmic | 2026 avg ~$1.16 (range ~$1.08–$1.20); 2030 avg ~$3.78 |
| Traders Union | Algorithmic | 2026 avg ~$2.60; 2030 avg ~$2.39 |
| Standard Chartered (Geoffrey Kendrick) | Institutional | $8.00 by end-2026 (target set when XRP traded near $1.86) |
| The Motley Fool | Editorial | ~$3.00 |
The spread is the story. Standard Chartered’s Geoffrey Kendrick tied his $8 end-2026 call to ETF inflows and regulatory clarity, but he set it when XRP traded near $1.86, well above today’s level. Algorithmic aggregators, working from price action rather than adoption narratives, land far lower and closer together. Traders Union sits awkwardly in between and even projects 2026 above its own 2030 figure. Kraken’s price tool is worth a caveat: it is a compounding calculator, not a forecast, and at a default 5% annual growth it simply steps XRP from about $1.06 in 2026 to roughly $1.29 by 2030. Anyone hunting for a single consensus number won’t find one here.
Track record of this forecast
This is the first published PrimeXBT price forecast for XRP. From the next monthly review onward, this section will compare the previous forecast against XRP’s actual price on the update date, and explain any miss rather than smoothing it over.
XRP technical analysis
XRP trades below its main longer-term average at the time of writing. The 200-day simple moving average sits near $1.38, and with spot near $1.07 the longer trend still points down. Momentum is flat rather than falling: the 14-day RSI reads about 49, squarely neutral, and trend strength is weak, so neither buyers nor sellers control the tape.
The support and resistance levels that matter now: support at the $1.00–$1.02 psychological zone defended since late June, then $0.95, with a deeper demand shelf around $0.84–$0.80; resistance at the $1.18–$1.22 band, then $1.25, then the heavier $1.38–$1.46 zone that coincides with the 200-day average. Reclaiming $1.38 would be the clearest signal that the longer downtrend has turned. Until then, XRP is range-bound between the dollar and its 200-day line. For a primer on reading these signals, see PrimeXBT’s guide to crypto technical analysis.
Correlation with other assets
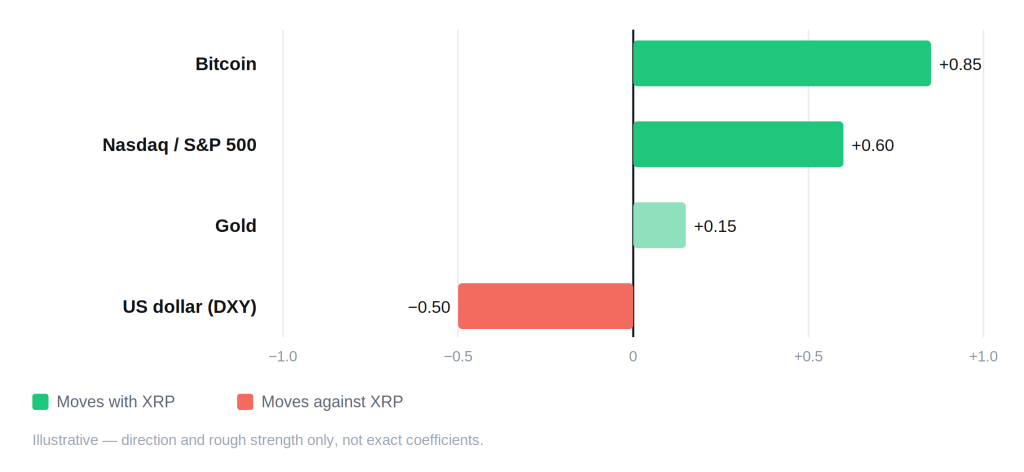
XRP still trades largely as a high-beta altcoin, rising and falling with Bitcoin, and its direction is tied to Bitcoin dominance: when capital rotates toward Bitcoin, altcoins including XRP tend to lag. Against the U.S. dollar index (DXY), XRP has historically moved inversely, a stronger dollar pressuring crypto and a weaker one supporting it. Since spot ETFs pulled institutions into the market, XRP has also tracked risk assets like the Nasdaq more closely, which is why Federal Reserve policy now shows up quickly in its price. XRP does keep one habit of its own: it can decouple sharply on Ripple-specific news, such as court rulings or ETF milestones. These are directional relationships, not fixed coefficients, and they shift over time.
Fundamental factors
The XRP Ledger settles transactions in three to five seconds at a fraction of a cent, using a consensus protocol rather than mining or staking. That design targets one job, moving value across borders, and Ripple, the company, builds payment and stablecoin products on top of it. XRP is the asset that carries value through those rails, which ties part of its demand to real payment volume rather than pure speculation.
Supply is the standing overhang. XRP has a fixed maximum of 100 billion tokens, of which about 62.5 billion circulate; Ripple holds a large reserve in escrow and can release up to 1 billion XRP a month. In practice most of each release is re-locked: the August 2026 unlock netted just 300 million new tokens, the tightest in recent memory, which softens the supply pressure the market often fears. Regulation is the other swing factor. The long-running SEC case is behind XRP, spot XRP ETFs now give institutions a regulated way to hold it, and their flows have become a price driver, though inflows cooled sharply through July 2026 after a strong launch. A broad U.S. market-structure bill, the CLARITY Act, was sidelined by the Senate on July 27, 2026, so the final piece of regulatory certainty is still pending. Macro sits on top of all of it, with the path of U.S. interest rates and the dollar setting the risk appetite XRP now trades on. For the wider context on how a coin’s supply feeds into valuation, see PrimeXBT’s explainer on cryptocurrency market capitalization.
Upcoming catalysts
Only confirmed, dated events are listed. Macro policy is the clearest near-term driver, given how closely XRP now tracks risk assets.
| Date | Event | Potential impact |
|---|---|---|
| September 15–16, 2026 | FOMC meeting (with economic projections) | Bull if the Fed signals cuts; bear if it holds rates higher for longer |
| October 27–28, 2026 | FOMC meeting | Rate path drives risk appetite across crypto |
| December 8–9, 2026 | FOMC meeting (with economic projections) | Year-end policy signal for 2027 positioning |
| 1st of each month | Ripple escrow unlock (up to 1 billion XRP, most re-locked) | Supply overhang, usually neutral when net new supply stays small |
FOMC dates follow the Federal Reserve’s published 2026 schedule. The escrow unlock is a recurring, confirmed mechanism rather than a one-off event; its market impact depends on how much of each release Ripple re-locks. No dated XRP-specific network event is confirmed for the rest of 2026, so none is invented here.
Bull case vs bear case
Bull case:
- The Fed shifts to rate cuts, and capital rotates back into risk assets including XRP.
- Spot XRP ETF inflows resume after the mid-2026 lull, adding steady institutional demand.
- U.S. market-structure legislation clears, removing the last regulatory overhang.
- Ripple keeps net escrow releases small, limiting new supply hitting the market.
Bear case:
- Rates stay higher for longer, keeping risk assets under pressure.
- XRP keeps lagging Bitcoin, stuck below its 200-day average with weak momentum.
- ETF flows stay flat or turn negative, removing a key source of demand.
- The $1.00 support gives way and selling accelerates toward the lower shelf.
Invalidation levels. The bull case weakens if XRP closes below $1.00, the psychological support, with $0.95 and then $0.84 as the next shelves. The bear case is invalidated on a sustained break above the $1.18–$1.22 band and, more decisively, a reclaim of the 200-day average near $1.38, roughly 29% above the early-August price and the line that would mark the downtrend as broken. These are the same levels from the technical section, not separate numbers.
Historical performance
XRP’s history is a series of violent cycles, not a steady climb. It ran to an early record near $3.40 in January 2018, then lost more than 90% over the following two years. It broke to a new all-time high of $3.65 in July 2025 on the back of regulatory wins and ETF anticipation, peaked again near $2.41 in January 2026, and has since given back more than half of that, trading around $1.07 in early August 2026, below its own 200-day average. The shape matters more than any single past price, and no cycle is obliged to repeat the last one.
Is XRP a good investment in 2026?
The answer depends on time horizon and risk tolerance. Our outlook sees XRP consolidating into year-end, a roughly $1.20 average for 2026, with the market repairing rather than trending. The facts underneath are steadier: XRP sits below its long-term average, momentum is neutral, ETF demand has cooled, and the near-term path runs through Fed policy and U.S. regulation. Whether that reads as a discounted entry or a value trap is the reader’s call. PrimeXBT’s explainer on whether XRP is a good investment digs into the case, and the XRP versus Bitcoin comparison covers how it stacks up against the market leader.
How to trade XRP on PrimeXBT
On PrimeXBT you can take a position on XRP in either direction. CFDs on XRP can be traded long or short, so a view that the price falls is as tradable as a view that it rises; see the guide to trading XRP for the mechanics. Leverage magnifies gains and losses alike, so position sizing and a stop-loss matter on any trade. Trade on your own analysis and risk tolerance, and never risk more than you can afford to lose.
Trading involves risk.
How we build this forecast
This outlook is put together by PrimeXBT’s analysts, not lifted from a single price feed. We start from where XRP trades today, read its position against the 50- and 200-day moving averages and the key support and resistance levels, weigh the fundamentals, payment adoption, escrow supply, ETF flows and regulation, and set all of it against the macro backdrop, chiefly the path of U.S. interest rates. The yearly ranges combine that technical read with the fundamental and macro picture; the long-range figures lean on trajectory rather than precision.
None of this is a guarantee. Crypto is volatile, the inputs shift, and one macro or regulatory surprise can move XRP faster than any forecast expects. Treat every figure here as a considered estimate, not a promise, and note that we revisit and update the outlook monthly as the data changes.
How much will XRP be worth in 2026?
Our outlook is roughly $1.00–$1.40 for 2026, averaging near $1.20, a consolidation year rather than a new bull market.
How much will XRP be worth in 2030?
Our 2030 view is roughly $2.60–$4.60, averaging near $3.55, which would revisit the 2025 record high. Five-year forecasts are low-confidence by nature.
What will XRP be worth in five years?
See 2030 above. On this horizon, treat any single number as a direction rather than a target, and expect the plausible range to span several dollars.
Can XRP reach $10?
Not on our numbers through 2030, where the top of the modeled range is about $4.58. Reaching $10 would require a stronger and longer cycle than the current picture supports; even the more bullish long-range paths sit closer to $8–$9 by 2050.
Is XRP a good investment in 2026?
Mixed. XRP trades below its long-term average with neutral momentum and cooling ETF demand, but its regulatory picture and payment use case are clearer than in past cycles. The case runs both ways, and the answer depends on your time horizon and risk tolerance.
What will XRP be worth tomorrow?
This page updates monthly and does not publish next-day price targets, since a single-day figure would be wrong within days and stay uncorrected until the next review. For the price right now, use the live chart above; near term, XRP has held a rough $1.00–$1.20 range.
How does Ripple's monthly escrow unlock affect XRP?
Ripple can release up to 1 billion XRP from escrow at the start of each month, but it re-locks most of it, so the net new supply is usually far smaller. The August 2026 release netted only about 300 million tokens. Large net unlocks can weigh on price; small ones tend to pass with little effect.
Author



 Risk Disclaimer
The content provided here is for informational purposes only. It is not intended as personal investment advice and does not constitute a solicitation or invitation to engage in any financial transactions, investments, or related activities. Past performance is not a reliable indicator of future results.
The financial products offered by the Company are complex and come with a high risk of losing money rapidly due to leverage. These products may not be suitable for all investors. Before engaging, you should consider whether you understand how these leveraged products work and whether you can afford the high risk of losing your money.
The Company does not accept clients from the Restricted Jurisdictions as indicated in our website/ T&C. Some services or products may not be available in your jurisdiction.
The applicable legal entity and its respective products and services depend on the client’s country of residence and the entity with which the client has established a contractual relationship during registration.