14 min read
 Stellar (XLM) trades near $0.16 in early August 2026, roughly 80% below the record it set more than eight years ago and stuck under both of its main moving averages. XLM is the native asset of the Stellar network — a payments-first blockchain built to move money across borders cheaply, settle stablecoin transfers, and cover the tiny per-transaction fee the network charges. This page lays out PrimeXBT’s price outlook for XLM through 2030 and out to 2050, the technical levels traders are watching now, and the catalysts that could shift the price. Figures are given as ranges rather than false-precise targets; where the picture is genuinely uncertain, we say so.
Stellar outlook at a glance
- Current price: $0.20264 per XLM.
- 2026 base case: a range of $0.152–$0.229, averaging near $0.19 — a year of basing rather than breakout.
- Main bullish catalyst: Fed rate cuts feeding risk appetite, plus stablecoin and tokenization volume settling on Stellar (USDC, PayPal’s PYUSD, MoneyGram, Franklin Templeton’s BENJI).
- Biggest downside risk: a sustained break below the $0.14 support, which would open the door to a deeper leg down.
- Long-term view: the multi-year path trends higher as payment volume grows, but every figure past 2030 is a direction, not a dated target.
Live Stellar price chart
Today (11 October 2026) Stellar (XLM/USD) is trading at $0.20264 per XLM, with a market cap of $7,140,007,897 USD. The 24-hour trading volume amounts to $156,400,388 USD. XLM price has changed by 2.96% in the last 24 hours. Stellar’s circulating supply is 35,059,787,753 XLM.
Trading involves risk.
Stellar price prediction 2026–2030 (yearly forecast)
The table sets our expected range for each year through 2030. The far more bullish institutional and editorial targets rest on different assumptions and are kept separate in the analyst section rather than blended in here.
| Year | Minimum | Average | Maximum |
|---|---|---|---|
| 2026 | $0.152 | $0.188 | $0.229 |
| 2027 | $0.195 | $0.239 | $0.290 |
| 2028 | $0.233 | $0.287 | $0.349 |
| 2029 | $0.263 | $0.331 | $0.416 |
| 2030 | $0.299 | $0.398 | $0.516 |
Stellar price prediction 2026
Our 2026 outlook holds XLM close to its early-August level near $0.16, in a range of $0.152–$0.229 averaging near $0.19. That is a base-building year, not a trend: the price sits below its converged moving averages, sentiment reads as fear, and nothing in the current setup points to a return toward the 2024–2025 highs within twelve months.
For the remainder of 2026, our month-by-month view keeps XLM in a narrow, slightly firming band rather than a directional move:
| Month (2026) | Minimum | Average | Maximum |
|---|---|---|---|
| August | $0.152 | $0.165 | $0.178 |
| September | $0.163 | $0.177 | $0.192 |
| October | $0.174 | $0.190 | $0.206 |
| November | $0.183 | $0.200 | $0.217 |
| December | $0.191 | $0.210 | $0.229 |
Stellar price prediction 2027
2027 is the recovery leg. Our outlook lifts XLM off the 2026 base toward a range of $0.195–$0.290, averaging near $0.24. The step up leans on wider stablecoin settlement and tokenized-asset volume on Stellar rather than on any single event, and it still leaves XLM well below its historical peak.
| Month (2027) | Minimum | Average | Maximum |
|---|---|---|---|
| January | $0.195 | $0.215 | $0.234 |
| February | $0.199 | $0.219 | $0.240 |
| March | $0.202 | $0.224 | $0.245 |
| April | $0.206 | $0.228 | $0.251 |
| May | $0.210 | $0.233 | $0.257 |
| June | $0.213 | $0.238 | $0.262 |
| July | $0.216 | $0.242 | $0.267 |
| August | $0.219 | $0.245 | $0.272 |
| September | $0.222 | $0.249 | $0.276 |
| October | $0.224 | $0.253 | $0.281 |
| November | $0.227 | $0.256 | $0.286 |
| December | $0.230 | $0.260 | $0.290 |
Stellar price prediction 2028
2028 carries the trend higher into the back half of the broader crypto cycle. We model XLM in a range of $0.233–$0.349, averaging near $0.29. Payment and remittance flows are the swing factor here: the more real settlement volume Stellar captures, the better the case for the upper half of that band.
| Month (2028) | Minimum | Average | Maximum |
|---|---|---|---|
| January | $0.233 | $0.265 | $0.296 |
| February | $0.237 | $0.269 | $0.302 |
| March | $0.240 | $0.274 | $0.308 |
| April | $0.243 | $0.278 | $0.314 |
| May | $0.247 | $0.283 | $0.319 |
| June | $0.250 | $0.288 | $0.325 |
| July | $0.253 | $0.291 | $0.330 |
| August | $0.254 | $0.294 | $0.334 |
| September | $0.256 | $0.297 | $0.338 |
| October | $0.258 | $0.300 | $0.341 |
| November | $0.259 | $0.302 | $0.345 |
| December | $0.261 | $0.305 | $0.349 |
Stellar price prediction 2029
2029 extends the climb at a slower grade, with our range at $0.263–$0.416 and an average near $0.33. By this point the outlook depends less on market cycles and more on whether Stellar’s institutional integrations translate into sustained on-chain activity.
| Month (2029) | Minimum | Average | Maximum |
|---|---|---|---|
| January | $0.263 | $0.309 | $0.354 |
| February | $0.266 | $0.313 | $0.359 |
| March | $0.269 | $0.317 | $0.365 |
| April | $0.271 | $0.320 | $0.370 |
| May | $0.274 | $0.324 | $0.375 |
| June | $0.276 | $0.328 | $0.380 |
| July | $0.279 | $0.332 | $0.386 |
| August | $0.282 | $0.337 | $0.392 |
| September | $0.285 | $0.341 | $0.398 |
| October | $0.288 | $0.346 | $0.404 |
| November | $0.291 | $0.350 | $0.410 |
| December | $0.294 | $0.355 | $0.416 |
Stellar price prediction 2030
2030 is the high point of our five-year window: a range of $0.299–$0.516, averaging near $0.40. Five years out the outlook leans on trajectory over precision, so read the month-by-month path below as a shape rather than a set of dated targets. Even at the top of this band, XLM would still trade under its 2018 record.
| Month (2030) | Minimum | Average | Maximum |
|---|---|---|---|
| January | $0.299 | $0.362 | $0.425 |
| February | $0.304 | $0.369 | $0.434 |
| March | $0.308 | $0.376 | $0.443 |
| April | $0.313 | $0.383 | $0.452 |
| May | $0.318 | $0.390 | $0.461 |
| June | $0.323 | $0.397 | $0.470 |
| July | $0.327 | $0.403 | $0.479 |
| August | $0.330 | $0.408 | $0.486 |
| September | $0.334 | $0.414 | $0.494 |
| October | $0.337 | $0.419 | $0.501 |
| November | $0.341 | $0.425 | $0.508 |
| December | $0.344 | $0.430 | $0.516 |
Stellar long-term price prediction: 2035, 2040–2050
Forecasts this far out are estimates dressed as numbers. No model can price a decade of payment-market shifts, stablecoin regulation, and macro regimes that don’t exist yet, so treat everything below as a rough trajectory — the error bars widen with every year out. On that basis our long-range path keeps grinding higher as settlement volume compounds, with our outlook averaging near $0.50 in 2035, near $0.60 in 2040, and near $0.95 by 2050. Reclaiming $1 is a 2050-horizon scenario on our numbers, not a near-term one.
| Year | Minimum | Average | Maximum |
|---|---|---|---|
| 2035 | $0.380 | $0.500 | $0.620 |
| 2040 | $0.420 | $0.600 | $0.780 |
| 2050 | $0.589 | $0.950 | $1.311 |
What analysts and models say (compared)
Forecasts for XLM span an unusually wide gap, and the split is methodological. Algorithmic price models sit low and close to spot; editorial and cycle-based forecasts sit multiples higher. Averaging the two groups would produce a number that describes neither, so they are laid out side by side.
| Source | Method | Stellar view |
|---|---|---|
| CoinCodex | Algorithmic | 2026 avg ~$0.20 (range ~$0.16–$0.24); ~$0.39 by 2030; ~$0.98 by 2050 |
| Changelly / model aggregate | Algorithmic | 2026 avg ~$0.19; 2030 avg ~$0.35; 2040 avg ~$0.55 |
| Coinpedia | Editorial / cycle-based | Up to ~$2.50 in 2026 and ~$5–$7 by 2030 in a strong cycle |
The spread is the story. Algorithmic models extrapolate from current price and momentum, which is why CoinCodex and similar tools keep XLM under $0.50 for most of the decade. Editorial forecasts such as Coinpedia’s assume a full payments-adoption breakout and a strong altcoin cycle, which is how they reach several dollars. Both can’t be right, and anyone hunting for a single consensus number won’t find one here. Our own outlook sits closer to the algorithmic cluster because it is anchored to where XLM actually trades today.
Track record of this forecast
This is the first published PrimeXBT price forecast for Stellar. From the next monthly review onward, this section will compare the previous forecast against XLM’s actual price on the update date, and explain any miss rather than smoothing it over.
Stellar technical analysis
XLM trades below both of its most-watched moving averages. The 50-day and 200-day simple moving averages have converged near $0.20, and the price sits under both around $0.16 — a market that has lost its uptrend and is consolidating rather than trending. The RSI reads in the mid-30s, leaning toward oversold without hitting an extreme, and the broader Fear & Greed backdrop sits in “Fear.”
The support and resistance levels that matter now: support at $0.14, the floor that has held on recent pullbacks; resistance first at the $0.20 moving-average cluster, then at $0.26. Reclaiming $0.20 and holding above it would be the clearest sign the downtrend has stalled; losing $0.14 on a closing basis would signal the opposite. For a primer on reading these signals, see PrimeXBT’s guide to crypto technical analysis. Levels reflect the picture at the time of writing and are updated each month.
Correlation with other assets
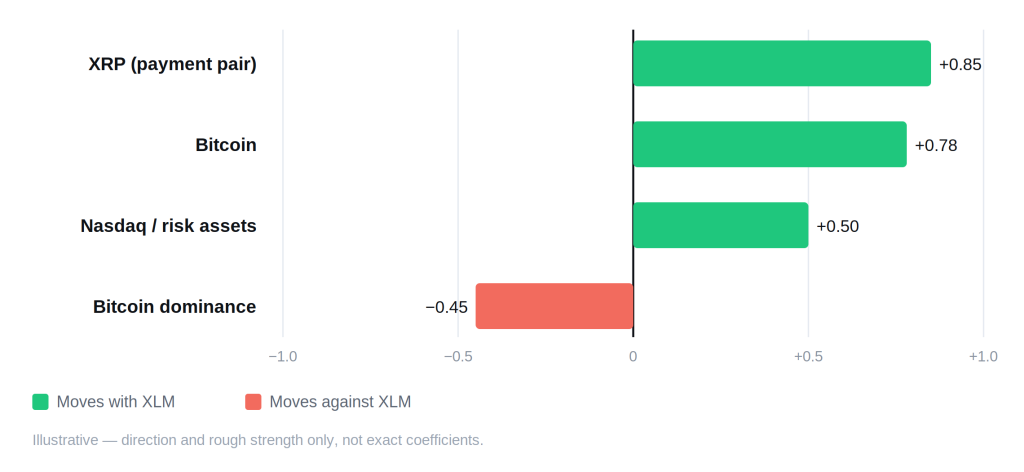
Stellar’s tightest relationship is not with Bitcoin but with XRP. The two payment-focused tokens trade almost as a pair: a regulatory headline, a partnership, or an ETF rumor for one routinely moves the other the same day, because investors treat them as the two liquid ways to bet on blockchain-based cross-border settlement. Our comparison of XLM and XRP covers where that shared thesis holds and where it breaks. Beyond that pairing, XLM behaves as a high-beta altcoin: it rallies harder than Bitcoin in an altcoin-led “altseason” and lags when money rotates back into Bitcoin, so it tends to weaken when Bitcoin dominance rises. As a risk asset it drifts with the Nasdaq, which is why Fed policy shows up quickly in its price. What XLM does not have is a store-of-value narrative — it takes no cue from gold and carries none of Bitcoin’s “digital gold” framing. These are directional relationships, not fixed coefficients, and they shift over time.
Fundamental factors
Stellar runs on the Stellar Consensus Protocol, a Federated Byzantine Agreement design rather than proof-of-work or proof-of-stake. Transactions confirm in seconds for fractions of a cent, but there is no mining and no staking yield — holding XLM does not earn a network reward, which sets it apart from proof-of-stake assets. The network is stewarded by the Stellar Development Foundation (SDF), a non-profit that funds development and holds a large share of the supply.
Stellar’s thesis is utility in cross-border payments, remittances, and stablecoin on- and off-ramps rather than speculation. USDC issued by Circle settles on Stellar, PayPal’s PYUSD is now available on the network, and MoneyGram uses Stellar for its cash-to-stablecoin service and has launched its own MGUSD stablecoin on the chain. Franklin Templeton runs BENJI, the first U.S.-registered tokenized money-market fund on a public blockchain, on Stellar. Soroban, the network’s smart-contract platform, extends Stellar beyond simple payments toward programmable stablecoin and tokenization use cases. Each integration is a source of real settlement volume, though volume does not translate mechanically into token price.
Supply is a distinct part of the story. In November 2019 the SDF burned roughly 55 billion XLM — more than half the tokens then in existence — and disabled the network’s inflation mechanism. Since then there has been no ongoing issuance: the maximum supply is fixed at 50 billion XLM, of which around 34 billion circulates, with the SDF holding the remainder for development and ecosystem funding. That fixed cap removes the dilution overhang that weighs on inflationary tokens, though the SDF’s holdings remain a supply factor the market watches.
Upcoming catalysts
Only confirmed, dated events are listed. Stellar has no network hard fork or token-unlock event on a fixed public date at the time of writing, so the near-term calendar is macro-driven — and given how closely XLM tracks risk assets, Fed policy is the clearest scheduled driver.
| Date | Event | Potential impact |
|---|---|---|
| September 15–16, 2026 | FOMC meeting (with economic projections) | Bull if the Fed signals cuts; bear if it holds rates higher for longer |
| October 27–28, 2026 | FOMC meeting | Rate path drives risk appetite across altcoins |
| December 8–9, 2026 | FOMC meeting (with economic projections) | Year-end policy signal for 2027 positioning |
FOMC dates follow the Federal Reserve’s published 2026 schedule. No Stellar-specific event carries a confirmed date, so none is listed — an estimated date would be a guess, not information.
Bull case vs bear case
Bull case:
- The Fed shifts to rate cuts and capital rotates back into altcoins, XLM among them.
- Stablecoin settlement and tokenization volume on Stellar keep growing as USDC, PYUSD, MGUSD, and BENJI scale.
- An altcoin-led rally lifts high-beta payment tokens faster than the broad market.
- The fixed 50 billion cap keeps a lid on dilution as demand recovers.
Bear case:
- Rates stay higher for longer, keeping risk assets and altcoins under pressure.
- Bitcoin dominance rises and capital drains out of alts, with XLM lagging.
- Real settlement volume grows without lifting the token price, keeping XLM range-bound.
- Momentum stays weak and the $0.14 support gives way.
Invalidation levels. The bull case weakens if XLM closes below $0.14, the floor from the technical section. The bear case is invalidated on a sustained reclaim of the $0.20 moving-average cluster and, more decisively, a break above $0.26 resistance — roughly 60% above the early-August price and the line that would mark the downtrend as broken. These are the same levels from the technical section, not separate numbers.
Historical performance
Stellar’s history is a series of sharp cycles, not a steady climb. XLM set its record near $0.875 in early January 2018, ran to a lower secondary peak around $0.79 in 2021, and rallied again in the 2024–2025 cycle before fading. In early August 2026 it trades roughly 80% below that 2018 high and below its own converged moving averages. The shape matters more than any single past price, and no cycle is obliged to repeat the last one.
Is Stellar a good investment in 2026?
The answer depends on time horizon and risk tolerance. Our outlook sees XLM roughly flat into year-end — an average near $0.19 for 2026 — with the market basing rather than breaking out. The facts underneath are steadier than the price: Stellar has fixed supply, live institutional integrations, and genuine payment volume, but none of that has yet pulled the token out of its range. Whether that reads as a discounted entry or a value trap is the reader’s call. PrimeXBT’s explainer on what Stellar (XLM) is and how it works digs into the network behind the token.
How to trade Stellar on PrimeXBT
On PrimeXBT you can take a position on Stellar in either direction, independent of any forecast. CFDs on XLM can be traded long or short, so you can act on your own read of the market whether you expect the price to rise or fall — see the guide to long and short positions. Leverage magnifies gains and losses alike, so position sizing and a stop-loss matter on any trade. Trade on your own analysis and risk tolerance, and never risk more than you can afford to lose.
Trading involves risk.
How we build this forecast
This outlook is put together by PrimeXBT’s analysts, not lifted from a single price feed. We start from where XLM trades today, read its position against the 50- and 200-day moving averages and the key support and resistance levels, weigh the fundamentals — fixed supply, the Stellar Consensus Protocol, stablecoin settlement, and institutional integrations like BENJI and MoneyGram — and set all of it against the macro backdrop, chiefly the path of U.S. interest rates. The yearly ranges combine that technical read with the fundamental and macro picture; the long-range figures lean on trajectory rather than precision.
None of this is a guarantee. Crypto is volatile, the inputs shift, and one macro surprise can move XLM faster than any forecast expects. Treat every figure here as a considered estimate, not a promise — we revisit and update the outlook monthly as the data changes.
How much will Stellar be worth in 2026?
Our outlook averages near $0.19 for 2026, with the market basing rather than breaking out.
How much will Stellar be worth in 2030?
Our long-range view averages near $0.40 for 2030, the high point of our five-year window. Five-year forecasts are low-confidence by nature.
What will Stellar be worth in five years?
See 2030 above. On this horizon treat any single figure as a direction rather than a target — the plausible range is wide.
Will Stellar reach $1?
Not within our five-year window: our 2030 outlook averages near $0.40. On our numbers, a return to $1 is a long-horizon scenario closer to 2050, and it would take a stronger payments-adoption cycle than the current picture shows.
Is Stellar a good investment in 2026?
Mixed: a roughly flat near-term outlook and fearful sentiment sit against fixed supply and real institutional payment integrations. The case runs both ways and depends on your time horizon.
Author



 Risk Disclaimer
The content provided here is for informational purposes only. It is not intended as personal investment advice and does not constitute a solicitation or invitation to engage in any financial transactions, investments, or related activities. Past performance is not a reliable indicator of future results.
The financial products offered by the Company are complex and come with a high risk of losing money rapidly due to leverage. These products may not be suitable for all investors. Before engaging, you should consider whether you understand how these leveraged products work and whether you can afford the high risk of losing your money.
The Company does not accept clients from the Restricted Jurisdictions as indicated in our website/ T&C. Some services or products may not be available in your jurisdiction.
The applicable legal entity and its respective products and services depend on the client’s country of residence and the entity with which the client has established a contractual relationship during registration.