15 min read
 VeChain (VET) trades near $0.0046 in early August 2026, roughly 98% below its April 2021 record and still working back from a heavy year-to-date decline. VET is the native token of VeChainThor, a layer-1 blockchain built for enterprise supply-chain tracking and sustainability data, where it carries value and secures the network while a second token, VTHO, pays for transactions. This page lays out PrimeXBT’s price outlook for VET through 2030 and out to 2050, the technical levels traders are watching now, and the catalysts that could move it. Figures are given as ranges rather than false-precise targets; where the picture is genuinely uncertain, we say so.
VeChain outlook at a glance
- Current price: $0.007896 per VET.
- 2026 base case: a year of basing near current levels, averaging near $0.0050 rather than a fresh trend higher.
- Main bullish catalyst: the next Bitcoin-led altcoin cycle plus rising StarGate staking participation locking up float.
- Biggest downside risk: a risk-off market and a sustained break below the $0.00427 support that opens the door toward $0.0035.
- Long-term view: the outlook trends higher into the late-2020s cycle, but any figure past 2030 is a direction, not a target.
Live VeChain price chart
Today (11 October 2026) VeChain (VET/USD) is trading at $0.007896 per VET, with a market cap of $691,810,572 USD. The 24-hour trading volume amounts to $10,131,224 USD. VET price has changed by 2.37% in the last 24 hours. VeChain’s circulating supply is 85,985,041,177 VET.
Trading involves risk.
VeChain price prediction 2026–2030 (yearly forecast)
The table sets our expected range for each year. VET is a mid-cap altcoin with thinner forecast coverage than Bitcoin or Ethereum, so the bands are wide by design and the outer institutional targets are kept in the analyst section rather than blended in here.
| Year | Minimum | Average | Maximum |
|---|---|---|---|
| 2026 | $0.00419 | $0.00500 | $0.00595 |
| 2027 | $0.00513 | $0.00748 | $0.01045 |
| 2028 | $0.00842 | $0.01308 | $0.01932 |
| 2029 | $0.01440 | $0.02030 | $0.02647 |
| 2030 | $0.01254 | $0.01769 | $0.02319 |
VeChain price prediction 2026
Our 2026 outlook keeps VET close to its early-August level near $0.0046, with a full-year range of $0.00419–$0.00595 and an average near $0.0050. That is a market basing after a steep drawdown, not one breaking out. VET spent the first half of the year losing ground, and the base case is a floor forming rather than a new leg up before the next broad crypto cycle arrives.
For the rest of 2026, the month-by-month view holds VET in a narrow band that firms slightly into year-end:
| Month (2026) | Minimum | Average | Maximum |
|---|---|---|---|
| August | $0.00419 | $0.00460 | $0.00501 |
| September | $0.00435 | $0.00480 | $0.00525 |
| October | $0.00452 | $0.00500 | $0.00548 |
| November | $0.00469 | $0.00520 | $0.00571 |
| December | $0.00485 | $0.00540 | $0.00595 |
VeChain price prediction 2027
2027 is the first recovery year in our model: the range widens to $0.00513–$0.01045 with an average near $0.0075 as liquidity returns to altcoins. The step up rests on the broader market turning rather than any single VeChain announcement, since VET’s price has historically followed Bitcoin’s cycle more than its own news flow.
| Month (2027) | Minimum | Average | Maximum |
|---|---|---|---|
| January | $0.00513 | $0.00572 | $0.00632 |
| February | $0.00540 | $0.00605 | $0.00669 |
| March | $0.00567 | $0.00637 | $0.00707 |
| April | $0.00594 | $0.00669 | $0.00745 |
| May | $0.00620 | $0.00702 | $0.00783 |
| June | $0.00647 | $0.00734 | $0.00821 |
| July | $0.00672 | $0.00765 | $0.00859 |
| August | $0.00697 | $0.00796 | $0.00896 |
| September | $0.00722 | $0.00827 | $0.00933 |
| October | $0.00746 | $0.00858 | $0.00970 |
| November | $0.00771 | $0.00889 | $0.01008 |
| December | $0.00795 | $0.00920 | $0.01045 |
VeChain price prediction 2028
2028 carries the trend higher, to a range of $0.00842–$0.01932 and an average near $0.0130. The 2028 Bitcoin halving falls in this window, and altcoins have historically peaked in the twelve-to-eighteen months after a halving rather than the year of it, which shapes the build toward 2029 in our model.
| Month (2028) | Minimum | Average | Maximum |
|---|---|---|---|
| January | $0.00842 | $0.00978 | $0.01115 |
| February | $0.00890 | $0.01037 | $0.01184 |
| March | $0.00937 | $0.01095 | $0.01254 |
| April | $0.00983 | $0.01154 | $0.01324 |
| May | $0.01030 | $0.01212 | $0.01395 |
| June | $0.01076 | $0.01271 | $0.01466 |
| July | $0.01124 | $0.01332 | $0.01540 |
| August | $0.01173 | $0.01395 | $0.01618 |
| September | $0.01223 | $0.01459 | $0.01696 |
| October | $0.01271 | $0.01523 | $0.01774 |
| November | $0.01320 | $0.01586 | $0.01853 |
| December | $0.01368 | $0.01650 | $0.01932 |
VeChain price prediction 2029
2029 holds the cycle high in our outlook: a range of $0.01440–$0.02647 and an average near $0.0200, the peak year across the five-year table. This is where the post-halving altcoin phase and any enterprise-adoption momentum would coincide, and it is also the point where our error bars are widest inside the near horizon.
| Month (2029) | Minimum | Average | Maximum |
|---|---|---|---|
| January | $0.01440 | $0.01742 | $0.02045 |
| February | $0.01511 | $0.01835 | $0.02158 |
| March | $0.01581 | $0.01927 | $0.02273 |
| April | $0.01651 | $0.02019 | $0.02387 |
| May | $0.01720 | $0.02112 | $0.02503 |
| June | $0.01789 | $0.02204 | $0.02618 |
| July | $0.01798 | $0.02223 | $0.02647 |
| August | $0.01748 | $0.02168 | $0.02588 |
| September | $0.01698 | $0.02114 | $0.02529 |
| October | $0.01648 | $0.02059 | $0.02470 |
| November | $0.01599 | $0.02005 | $0.02410 |
| December | $0.01550 | $0.01950 | $0.02350 |
VeChain price prediction 2030
Our 2030 view eases off the peak to a range of $0.01254–$0.02319, averaging near $0.0175. Sources split here: some algorithmic models see VET continuing to climb through 2030, others a cool-down after 2029, and our path takes the cool-down view. Five years out the outlook leans on trajectory over precision, so read the month-by-month path below as a shape, not a set of dated targets.
| Month (2030) | Minimum | Average | Maximum |
|---|---|---|---|
| January | $0.01520 | $0.01919 | $0.02319 |
| February | $0.01490 | $0.01888 | $0.02287 |
| March | $0.01460 | $0.01858 | $0.02255 |
| April | $0.01431 | $0.01827 | $0.02223 |
| May | $0.01401 | $0.01796 | $0.02191 |
| June | $0.01372 | $0.01765 | $0.02159 |
| July | $0.01348 | $0.01741 | $0.02134 |
| August | $0.01329 | $0.01723 | $0.02116 |
| September | $0.01310 | $0.01705 | $0.02099 |
| October | $0.01291 | $0.01686 | $0.02081 |
| November | $0.01273 | $0.01668 | $0.02064 |
| December | $0.01254 | $0.01650 | $0.02046 |
VeChain long-term price prediction: 2035, 2040–2050
Forecasts this far out are guesses dressed as numbers. No model can price a decade of halving cycles, enterprise-adoption curves, and macro regimes that do not exist yet, so treat everything below as a rough trajectory rather than a target, with error bars that widen every year out. VeChain’s dependence on the broad altcoin cycle makes the uncertainty larger, not smaller. With that caveat, our long-range path trends higher without ever hockey-sticking, and stays far below the $1 mark that long-term holders often ask about:
| Year | Minimum | Average | Maximum |
|---|---|---|---|
| 2035 | $0.02304 | $0.03200 | $0.04096 |
| 2040 | $0.03630 | $0.05500 | $0.07370 |
| 2050 | $0.05800 | $0.10000 | $0.14200 |
What analysts and models say (compared)
VeChain forecasts sit unusually far apart, partly because some aggregators still carry stale price bases for the token. Algorithmic models that price off VET’s current sub-cent level cluster loosely between $0.005 and $0.05 across 2026–2030; at least one widely indexed model instead publishes figures near $0.15–$0.38, an order of magnitude above spot, which looks like a data artifact rather than a real thesis. Averaging figures built on incompatible starting points would mislead, so they are laid out side by side.
| Source | Method | VeChain view |
|---|---|---|
| Cryptopolitan | Algorithmic | 2026 avg ~$0.0053; 2030 avg ~$0.037 |
| CoinDataFlow | Algorithmic | 2026 max ~$0.0048; 2030 avg ~$0.017 |
| DigitalCoinPrice | Algorithmic | 2026 avg ~$0.19; 2030 avg ~$0.38 (prices well above spot — treat as outlier) |
| Coinbase (compilation) | Aggregated | Publishes multi-year VET ranges alongside peer models |
The spread is the story. Where CoinDataFlow sees VET cooling after a 2029 spike, Cryptopolitan has it still climbing into 2030, and DigitalCoinPrice’s numbers sit so far above the current price that they cannot be reconciled with the others. VeChain has no equivalent of a Standard Chartered or ARK issuing a headline VET target, so there is no institutional anchor to lean on. Anyone hunting for a single agreed number will not find one here.
Track record of this forecast
This is the first published PrimeXBT price forecast for VeChain under the current method. From the next monthly review onward, this section will compare the previous forecast against VET’s actual price on the update date, and explain any miss rather than smoothing it over.
VeChain technical analysis
VET sits pinned to its 50-day moving average and well below its 200-day. As of publication it trades around its 50-day simple moving average near $0.0047, while the 200-day average sits higher near $0.0070, a gap that marks the longer trend as still down. The RSI reads close to neutral on the daily near 47, but the weekly RSI near 31 shows how much momentum the past year drained. Reclaiming the 200-day average near $0.0070 is the clearest signal a trader could ask for that the downtrend has broken.
The support and resistance levels that matter now: support at $0.00427, then $0.0035, with a deeper weekly floor closer to $0.0018; resistance at $0.00535, then $0.0060 and the $0.0070 zone that coincides with the 200-day line. Sentiment has leaned cautious rather than fearful into early August, consistent with the soft weekly momentum. For a primer on reading these signals, see PrimeXBT’s guide to crypto technical analysis and the Fear & Greed Index.
Correlation with other assets
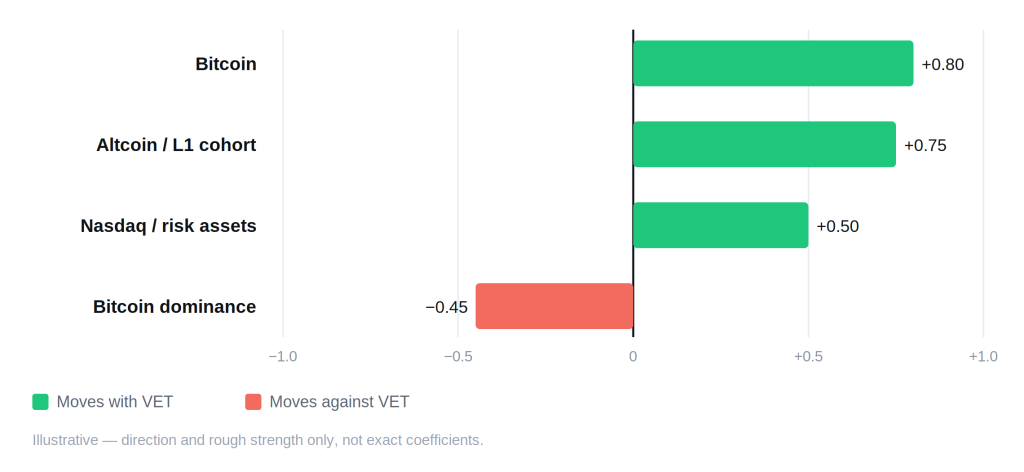
VeChain trades as a high-beta altcoin, which is the single most important thing to know about its price behavior. When Bitcoin moves, VET tends to move further in the same direction, and its fortunes swing with Bitcoin dominance: as capital concentrates in Bitcoin, VET and the rest of the smart-contract-platform cohort lag, and only in an altseason, when money rotates down the risk curve, does VET tend to outperform. Since crypto institutionalized, VET has also tracked risk assets like the Nasdaq more closely, so Federal Reserve policy now shows up quickly in its price. Unlike Bitcoin, VeChain carries no store-of-value or “digital gold” narrative, so it takes no support from the flows that chase gold in a risk-off market. These are directional relationships, not fixed coefficients, and they shift over time.
Fundamental factors
VeChain runs a dual-token model, and understanding it is the key to the fundamentals. VET is the value and staking asset; VTHO is the gas token that pays for transfers and smart-contract execution on VeChainThor. The design separates the price of holding the network’s value token from the cost of using the network, so business users can budget transaction fees in VTHO without exposure to VET’s volatility. A portion of the VTHO spent on fees is burned, tying network usage to token supply.
How VET produces VTHO changed in 2025. Historically, simply holding VET generated VTHO automatically; since the StarGate upgrade, which began rolling out in July 2025, rewards flow through active staking instead, with holders locking VET behind a tradable staking NFT to earn VTHO, and the old passive per-holding rewards phased out by October 2025. The accompanying Galactica upgrade introduced a dynamic fee market and broader EVM compatibility. Both sit inside VeChain’s multi-stage “Renaissance” roadmap.
VeChainThor secures itself with Proof of Authority 2.0-SURFACE, a consensus model run by a limited set of known validators rather than energy-intensive mining or open staking validation. VeChain markets it as one of the lower-energy consensus designs, which fits the network’s sustainability positioning, and it settles at roughly 100 transactions per second. That positioning also drives VeBetterDAO, VeChain’s sustainability and tokenization layer that rewards verifiable eco-friendly actions on-chain.
Adoption is VeChain’s differentiator and its question mark. The network has built enterprise and supply-chain relationships over the years, including certification body DNV, BMW, Walmart China, PwC, and carmaker BYD, plus a multi-year global marketing partnership with the UFC that put the brand in front of a mainstream audience. The open question for holders is how much of this pipeline converts into sustained on-chain volume rather than pilots. With circulating supply near 85.99 billion VET against a maximum of 86.71 billion, most of the supply is already in the market, so the float is not a hidden inflation risk the way it is for many younger tokens.
Upcoming catalysts
Only confirmed, dated events are listed. Macro policy is the clearest near-term driver, given how closely VET now tracks risk assets and Bitcoin.
| Date | Event | Potential impact |
|---|---|---|
| September 15–16, 2026 | FOMC meeting (with economic projections) | Bull if the Fed signals cuts; bear if it holds rates higher for longer |
| October 27–28, 2026 | FOMC meeting | Rate path drives risk appetite across crypto, and VET as a high-beta altcoin |
| December 8–9, 2026 | FOMC meeting (with economic projections) | Year-end policy signal for 2027 positioning |
FOMC dates follow the Federal Reserve’s published 2026 schedule. VeChain continues to ship network upgrades along its Renaissance roadmap, but no future mainnet date is confirmed at the time of writing, so no VeChain-specific upgrade is listed as a dated catalyst; an estimated date would be a guess, not information.
Bull case vs bear case
Bull case:
- A Bitcoin-led altseason rotates capital into high-beta altcoins, and VET moves further than the market.
- StarGate staking keeps pulling VET off the open market, thinning the float available to sell.
- Enterprise partnerships convert from pilots into recurring on-chain activity and VTHO burn.
- A weaker dollar and Fed rate cuts revive risk appetite across crypto.
Bear case:
- Bitcoin dominance stays high, and VET keeps lagging as capital avoids the long tail of altcoins.
- Adoption headlines fail to translate into measurable network usage.
- Rates stay higher for longer, keeping speculative altcoins under pressure.
- Momentum stays weak, VET holds below its 200-day average, and support gives way.
Invalidation levels. The bull case weakens if VET closes below $0.00427, the primary support, which would expose $0.0035 next. The bear case is invalidated on a sustained break above $0.00535 and, more decisively, a reclaim of the 200-day average near $0.0070, roughly 50% above the early-August price and the line that would mark the year-long downtrend as broken. These are the same levels from the technical section, not separate numbers.
Historical performance
VeChain’s history is a story of one euphoric cycle and a long descent from it. VET reached about $0.28 in April 2021, then fell more than 98% from that peak, and in early August 2026 it still trades in fractions of a cent, below its own 200-day average. It has posted sharp rallies inside that decline, including a strong run over the past year, but no move has come close to reclaiming the old high. The shape matters more than any single past price, and no cycle is obliged to repeat the last one.
Is VeChain a good investment in 2026?
The answer depends on time horizon and risk tolerance. Our outlook sees VET basing through 2026, averaging near $0.0050, with the next real move tied to the broader crypto cycle rather than to VeChain itself. The facts underneath are mixed: a real enterprise network and a supply that is mostly already circulating, set against a price 98% off its high, soft momentum, and a token whose direction is largely dictated by Bitcoin. VET is a higher-risk, higher-beta way to express a bullish altcoin view, and whether that reads as opportunity or warning is the reader’s call.
How to trade VeChain on PrimeXBT
On PrimeXBT you can take a position on VeChain in either direction. CFDs on VET can be traded long or short, so you can act on a bullish or a bearish view without holding the token itself. Leverage magnifies gains and losses alike, so position sizing and a stop-loss matter on any trade, especially on a token as volatile as VET. Trade on your own analysis and risk tolerance, and never risk more than you can afford to lose.
Trading involves risk.
How we build this forecast
This outlook is put together by PrimeXBT’s analysts, not lifted from a single price feed. We start from where VET trades today, read its position against the 50- and 200-day moving averages and the key support and resistance levels, weigh the fundamentals — the dual-token VET and VTHO model, StarGate staking, enterprise adoption, and supply — and set all of it against the macro backdrop and, above all, VET’s tight link to Bitcoin and the wider altcoin cycle. The yearly ranges combine that technical read with the fundamental and macro picture; the long-range figures lean on trajectory rather than precision.
None of this is a guarantee. Crypto is volatile, VeChain is a mid-cap altcoin that can move faster than the market in both directions, and one macro or Bitcoin surprise can override any forecast. Treat every figure here as a considered estimate, not a promise — we revisit and update the outlook monthly as the data changes.
How much will VeChain be worth in 2026?
Our outlook is roughly $0.00419–$0.00595 for 2026, averaging near $0.0050 — a year of basing near current levels rather than a breakout.
How much will VeChain be worth in 2030?
Our long-range view centers on an average near $0.0175 for 2030, within a wide band. Five-year forecasts are low-confidence by nature, so treat that as a direction rather than a target.
What will VeChain be worth in five years?
See 2030 above. On this horizon any single number is a rough trajectory, not a precise target, and the plausible range is wide.
Will VeChain reach $1?
Not on our numbers, and not within the horizon this page covers. VET trades near $0.0046, so $1 would be well over 200 times the current price; even our long-range 2050 view sits far below that. Reaching $1 would require a structural change in demand far beyond anything the current data shows.
Is VeChain a good investment in 2026?
Mixed. A real enterprise network and a mostly circulating supply, set against a price 98% below its high, soft momentum, and a direction largely dictated by Bitcoin. VET is a high-beta way to express a bullish altcoin view; the case runs both ways.
What will VeChain be worth tomorrow?
This page updates monthly and does not publish next-day price targets — a single-day figure would be wrong within days and stay uncorrected until the next review. For the price right now, use the live chart above; the nearest levels to watch are support at $0.00427 and resistance at $0.00535.
When Will VeChain Reach New Projected Highs?
Predicting prices is challenging enough, so there is no real way to predict when VeChain could reach new highs. However, if bullish momentum can keep up, new highs are possible in 2024 and 2025.
How Much Is The Maximum and Minimum To Invest in VeChain?
There is no real minimum and maximum to invest. VeChain tokens are cheap, and platforms like PrimeXBT only require a low deposit of 0.001 BTC to get started.
What is the VET Future Estimated Growth and Projected Value?
Estimate growth is all over the map for VET tokens, but long term projected value reaches as high as $1 per VET coin.
Author



 Risk Disclaimer
The content provided here is for informational purposes only. It is not intended as personal investment advice and does not constitute a solicitation or invitation to engage in any financial transactions, investments, or related activities. Past performance is not a reliable indicator of future results.
The financial products offered by the Company are complex and come with a high risk of losing money rapidly due to leverage. These products may not be suitable for all investors. Before engaging, you should consider whether you understand how these leveraged products work and whether you can afford the high risk of losing your money.
The Company does not accept clients from the Restricted Jurisdictions as indicated in our website/ T&C. Some services or products may not be available in your jurisdiction.
The applicable legal entity and its respective products and services depend on the client’s country of residence and the entity with which the client has established a contractual relationship during registration.